
|
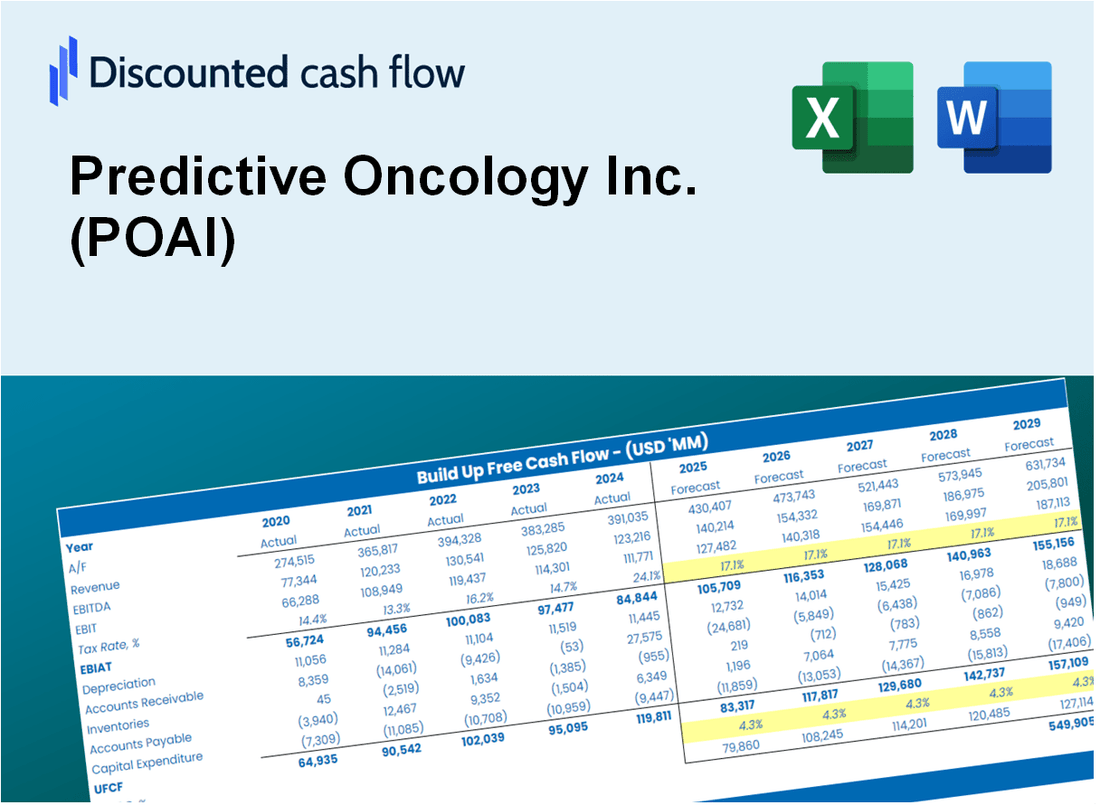
Predictive Oncology Inc. (POAI) DCF -Bewertung |
Fully Editable: Tailor To Your Needs In Excel Or Sheets
Professional Design: Trusted, Industry-Standard Templates
Investor-Approved Valuation Models
MAC/PC Compatible, Fully Unlocked
No Expertise Is Needed; Easy To Follow
Predictive Oncology Inc. (POAI) Bundle
Unser (POAI) DCF-Taschenrechner entwickelt für Genauigkeit und ermöglicht es Ihnen, die Bewertung der prädiktiven Onkologie in der Bewertung realer Finanzdaten zu bewerten, sowie die vollständige Flexibilität, um alle wesentlichen Parameter für erweiterte Projektionen zu ändern.
What You Will Receive
- Comprehensive Financial Model: Predictive Oncology Inc.'s actual data allows for accurate DCF valuation.
- Complete Forecast Control: Modify revenue growth, profit margins, WACC, and other essential factors.
- Real-Time Calculations: Automatic updates provide immediate feedback as you make adjustments.
- Professional-Grade Template: A polished Excel file crafted for high-quality valuation.
- Flexible and Reusable: Designed for adaptability, enabling repeated use for in-depth forecasts.
Key Features
- Customizable Forecast Inputs: Adjust essential factors such as revenue projections, EBITDA margins, and research expenditures.
- Instant DCF Valuation: Quickly computes intrinsic value, net present value (NPV), and other financial metrics.
- High-Precision Accuracy: Leverages Predictive Oncology's real-world data for reliable valuation results.
- Effortless Scenario Analysis: Easily explore various assumptions and evaluate different outcomes.
- Efficiency Booster: Avoid the hassle of constructing intricate valuation models from the ground up.
How It Works
- Download the Template: Gain immediate access to the Excel-based POAI DCF Calculator.
- Input Your Assumptions: Modify the yellow-highlighted cells for growth rates, WACC, margins, and additional factors.
- Instant Calculations: The model will automatically refresh Predictive Oncology's intrinsic value.
- Test Scenarios: Experiment with various assumptions to assess potential valuation shifts.
- Analyze and Decide: Utilize the outcomes to inform your investment or financial analysis.
Why Choose This Calculator for Predictive Oncology Inc. (POAI)?
- User-Friendly Interface: Tailored for both novices and seasoned professionals.
- Customizable Inputs: Easily adjust parameters to suit your analytical needs.
- Real-Time Feedback: Monitor immediate changes to Predictive Oncology’s valuation as you tweak inputs.
- Preloaded Data: Comes with Predictive Oncology’s actual financial metrics for swift evaluation.
- Relied Upon by Experts: Employed by investors and analysts for making data-driven decisions.
Who Should Use Predictive Oncology Inc. (POAI)?
- Investors: Gain insights into the oncology market with advanced predictive analytics tools.
- Healthcare Analysts: Streamline your research with comprehensive data models tailored for oncology.
- Consultants: Easily customize reports and presentations for clients in the healthcare sector.
- Oncology Researchers: Enhance your studies with real-time data and predictive outcomes.
- Educators and Students: Utilize it as a resource for practical applications in healthcare analytics courses.
What the Template Contains
- Preloaded POAI Data: Historical and projected financial data, including revenue, EBIT, and capital expenditures.
- DCF and WACC Models: Professional-grade sheets for calculating intrinsic value and Weighted Average Cost of Capital.
- Editable Inputs: Yellow-highlighted cells for adjusting revenue growth, tax rates, and discount rates.
- Financial Statements: Comprehensive annual and quarterly financials for deeper analysis.
- Key Ratios: Profitability, leverage, and efficiency ratios to evaluate performance.
- Dashboard and Charts: Visual summaries of valuation outcomes and assumptions.
Disclaimer
All information, articles, and product details provided on this website are for general informational and educational purposes only. We do not claim any ownership over, nor do we intend to infringe upon, any trademarks, copyrights, logos, brand names, or other intellectual property mentioned or depicted on this site. Such intellectual property remains the property of its respective owners, and any references here are made solely for identification or informational purposes, without implying any affiliation, endorsement, or partnership.
We make no representations or warranties, express or implied, regarding the accuracy, completeness, or suitability of any content or products presented. Nothing on this website should be construed as legal, tax, investment, financial, medical, or other professional advice. In addition, no part of this site—including articles or product references—constitutes a solicitation, recommendation, endorsement, advertisement, or offer to buy or sell any securities, franchises, or other financial instruments, particularly in jurisdictions where such activity would be unlawful.
All content is of a general nature and may not address the specific circumstances of any individual or entity. It is not a substitute for professional advice or services. Any actions you take based on the information provided here are strictly at your own risk. You accept full responsibility for any decisions or outcomes arising from your use of this website and agree to release us from any liability in connection with your use of, or reliance upon, the content or products found herein.