
|
Polar Power, Inc. (Pola) DCF -Bewertung |
Fully Editable: Tailor To Your Needs In Excel Or Sheets
Professional Design: Trusted, Industry-Standard Templates
Investor-Approved Valuation Models
MAC/PC Compatible, Fully Unlocked
No Expertise Is Needed; Easy To Follow
Polar Power, Inc. (POLA) Bundle
Bewerten Sie den finanziellen Ausblick von Polar Power, Inc. (POLA) wie ein Fachmann! Dieser (POLA) DCF-Taschenrechner bietet vorgefüllte Finanzdaten und die vollständige Flexibilität, um das Umsatzwachstum, WACC, Margen und andere wesentliche Annahmen zu ändern, um sich an Ihren Projektionen anzupassen.
What You Will Receive
- Customizable Excel Template: A fully editable Excel-based DCF Calculator featuring pre-filled financials for POLA.
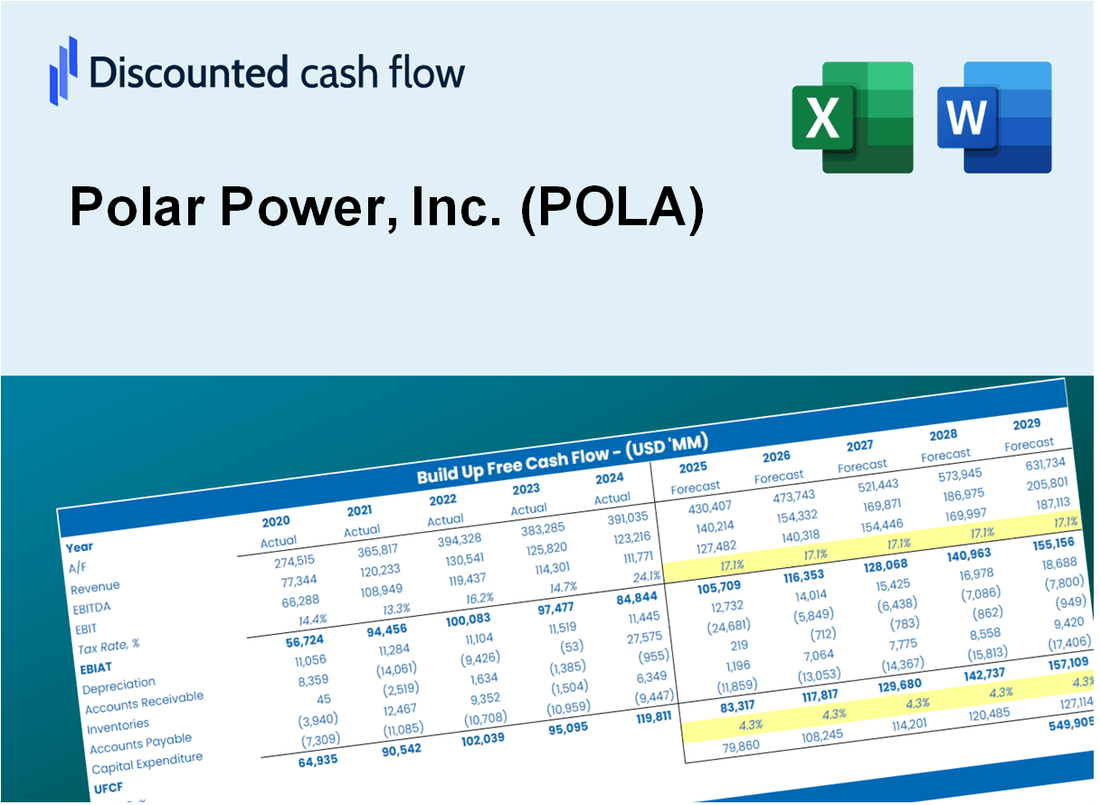
- Actual Data Insights: Historical performance data and forward-looking projections (highlighted in the yellow cells).
- Assumption Flexibility: Adjust key forecast parameters such as revenue growth, EBITDA %, and WACC.
- Instant Calculations: Quickly assess how your inputs affect Polar Power’s valuation.
- Professional Resource: Designed for investors, CFOs, consultants, and financial analysts.
- Intuitive Layout: Organized for clarity and simplicity, complete with step-by-step guidance.
Key Features
- Customizable Financial Inputs: Adjust essential metrics such as revenue projections, EBITDA margins, and capital investment plans.
- Instant DCF Valuation: Automatically computes intrinsic value, net present value, and additional financial metrics in real time.
- Industry-Leading Precision: Leverages Polar Power, Inc.'s (POLA) actual financial data for accurate valuation results.
- Simplified Scenario Analysis: Effortlessly evaluate various assumptions and analyze their impacts on outcomes.
- Efficiency Booster: Streamlines the valuation process, eliminating the need for intricate model creation from the ground up.
How It Works
- Step 1: Download the prebuilt Excel template featuring Polar Power, Inc. (POLA) data.
- Step 2: Navigate through the pre-filled sheets to familiarize yourself with the essential metrics.
- Step 3: Modify forecasts and assumptions in the editable yellow cells (WACC, growth, margins).
- Step 4: Instantly observe recalculated results, including Polar Power, Inc.'s (POLA) intrinsic value.
- Step 5: Make well-informed investment choices or create reports based on the outputs.
Why Choose This Calculator for Polar Power, Inc. (POLA)?
- Accurate Data: Up-to-date Polar Power financials ensure trustworthy valuation outcomes.
- Customizable: Modify essential parameters such as growth rates, WACC, and tax rates to align with your forecasts.
- Time-Saving: Ready-made calculations save you from starting from the ground up.
- Professional-Grade Tool: Tailored for investors, analysts, and consultants in the energy sector.
- User-Friendly: Easy-to-navigate design and step-by-step guidance make it accessible for everyone.
Who Should Use This Product?
- Individual Investors: Gain insights to make informed decisions about buying or selling Polar Power, Inc. (POLA) stock.
- Financial Analysts: Enhance valuation processes with comprehensive financial models tailored for Polar Power, Inc. (POLA).
- Consultants: Provide accurate and timely valuation insights related to Polar Power, Inc. (POLA) for your clients.
- Business Owners: Learn how companies like Polar Power, Inc. (POLA) are valued to inform your own business strategies.
- Finance Students: Explore valuation techniques through real-world data and case studies involving Polar Power, Inc. (POLA).
What the Polar Power, Inc. (POLA) Template Contains
- Comprehensive DCF Model: Editable template featuring detailed valuation calculations tailored for Polar Power, Inc.
- Real-World Data: Polar Power's historical and projected financials preloaded for thorough analysis.
- Customizable Parameters: Adjust WACC, growth rates, and tax assumptions to explore various scenarios.
- Financial Statements: Complete annual and quarterly breakdowns for enhanced insights into performance.
- Key Ratios: Integrated analysis for assessing profitability, efficiency, and leverage specific to Polar Power, Inc.
- Dashboard with Visual Outputs: Charts and tables designed for clear and actionable results related to Polar Power, Inc. (POLA).
Disclaimer
All information, articles, and product details provided on this website are for general informational and educational purposes only. We do not claim any ownership over, nor do we intend to infringe upon, any trademarks, copyrights, logos, brand names, or other intellectual property mentioned or depicted on this site. Such intellectual property remains the property of its respective owners, and any references here are made solely for identification or informational purposes, without implying any affiliation, endorsement, or partnership.
We make no representations or warranties, express or implied, regarding the accuracy, completeness, or suitability of any content or products presented. Nothing on this website should be construed as legal, tax, investment, financial, medical, or other professional advice. In addition, no part of this site—including articles or product references—constitutes a solicitation, recommendation, endorsement, advertisement, or offer to buy or sell any securities, franchises, or other financial instruments, particularly in jurisdictions where such activity would be unlawful.
All content is of a general nature and may not address the specific circumstances of any individual or entity. It is not a substitute for professional advice or services. Any actions you take based on the information provided here are strictly at your own risk. You accept full responsibility for any decisions or outcomes arising from your use of this website and agree to release us from any liability in connection with your use of, or reliance upon, the content or products found herein.