
|
Polycab India Limited (Polycab.NS) DCF -Bewertung |
Fully Editable: Tailor To Your Needs In Excel Or Sheets
Professional Design: Trusted, Industry-Standard Templates
Investor-Approved Valuation Models
MAC/PC Compatible, Fully Unlocked
No Expertise Is Needed; Easy To Follow
Polycab India Limited (POLYCAB.NS) Bundle
Vereinfachen Sie die Bewertung von Polycab India Limited (Polycabns) mit diesem anpassbaren DCF -Taschenrechner! Mit echten Polycab India Limited (Polycabns) Finanzdaten und einstellbaren Prognose -Inputs können Sie Szenarien testen und die bei den Polycabns (Polycabns) fairen Wert in Minuten aufdecken.
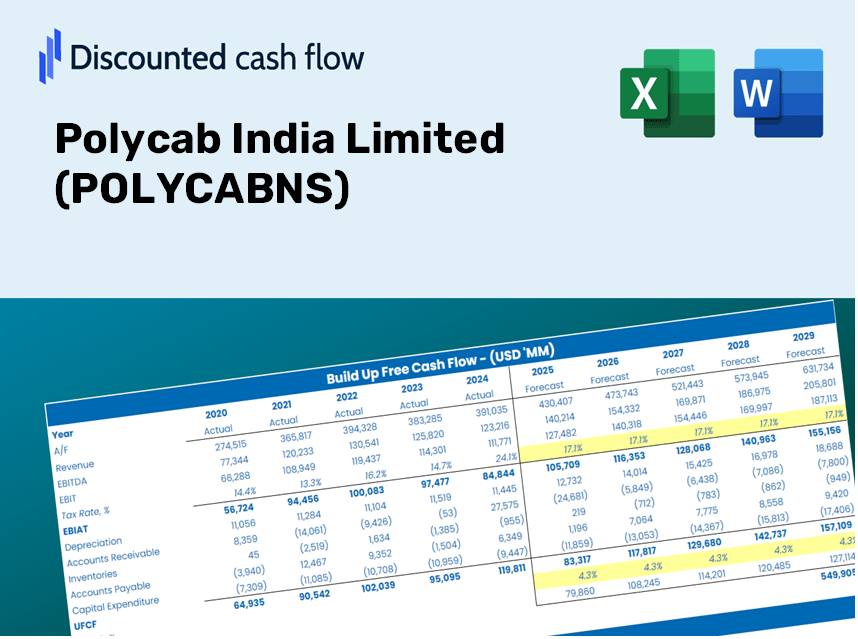
Discounted Cash Flow (DCF) - (USD MM)
| Year | AY1 2021 |
AY2 2022 |
AY3 2023 |
AY4 2024 |
AY5 2025 |
FY1 2026 |
FY2 2027 |
FY3 2028 |
FY4 2029 |
FY5 2030 |
|---|---|---|---|---|---|---|---|---|---|---|
| Revenue | 87,922.3 | 122,037.6 | 141,077.8 | 180,394.4 | 224,083.1 | 283,740.0 | 359,279.2 | 454,929.0 | 576,043.2 | 729,401.3 |
| Revenue Growth, % | 0 | 38.8 | 15.6 | 27.87 | 24.22 | 26.62 | 26.62 | 26.62 | 26.62 | 26.62 |
| EBITDA | 10,982.4 | 12,516.3 | 18,379.2 | 24,706.3 | 29,427.4 | 35,525.9 | 44,983.9 | 56,959.8 | 72,124.0 | 91,325.4 |
| EBITDA, % | 12.49 | 10.26 | 13.03 | 13.7 | 13.13 | 12.52 | 12.52 | 12.52 | 12.52 | 12.52 |
| Depreciation | 1,632.6 | 1,867.7 | 1,949.7 | 2,238.7 | 2,727.0 | 4,101.3 | 5,193.2 | 6,575.8 | 8,326.4 | 10,543.1 |
| Depreciation, % | 1.86 | 1.53 | 1.38 | 1.24 | 1.22 | 1.45 | 1.45 | 1.45 | 1.45 | 1.45 |
| EBIT | 9,349.8 | 10,648.6 | 16,429.5 | 22,467.7 | 26,700.4 | 31,424.6 | 39,790.7 | 50,384.0 | 63,797.6 | 80,782.2 |
| EBIT, % | 10.63 | 8.73 | 11.65 | 12.45 | 11.92 | 11.08 | 11.08 | 11.08 | 11.08 | 11.08 |
| Total Cash | 11,543.6 | 11,708.8 | 20,500.4 | 22,340.9 | 25,452.8 | 34,615.2 | 43,830.7 | 55,499.6 | 70,275.1 | 88,984.2 |
| Total Cash, percent | .0 | .0 | .0 | .0 | .0 | .0 | .0 | .0 | .0 | .0 |
| Account Receivables | 14,777.6 | 13,320.8 | 12,883.5 | 21,013.4 | 27,045.1 | 34,373.9 | 43,525.2 | 55,112.7 | 69,785.2 | 88,363.9 |
| Account Receivables, % | 16.81 | 10.92 | 9.13 | 11.65 | 12.07 | 12.11 | 12.11 | 12.11 | 12.11 | 12.11 |
| Inventories | 20,799.6 | 25,175.5 | 32,584.6 | 39,811.1 | 37,839.1 | 60,344.8 | 76,410.2 | 96,752.6 | 122,510.7 | 155,126.3 |
| Inventories, % | 23.66 | 20.63 | 23.1 | 22.07 | 16.89 | 21.27 | 21.27 | 21.27 | 21.27 | 21.27 |
| Accounts Payable | 13,480.3 | 12,175.3 | 8,068.9 | 10,013.6 | 14,295.2 | 24,378.1 | 30,868.2 | 39,086.2 | 49,492.0 | 62,668.1 |
| Accounts Payable, % | 15.33 | 9.98 | 5.72 | 5.55 | 6.38 | 8.59 | 8.59 | 8.59 | 8.59 | 8.59 |
| Capital Expenditure | -1,934.9 | -5,266.9 | -4,794.5 | -8,585.2 | -9,696.3 | -10,782.9 | -13,653.5 | -17,288.5 | -21,891.1 | -27,719.1 |
| Capital Expenditure, % | -2.2 | -4.32 | -3.4 | -4.76 | -4.33 | -3.8 | -3.8 | -3.8 | -3.8 | -3.8 |
| Tax Rate, % | 25.21 | 25.21 | 25.21 | 25.21 | 25.21 | 25.21 | 25.21 | 25.21 | 25.21 | 25.21 |
| EBITAT | 8,148.4 | 8,670.5 | 12,229.2 | 16,989.5 | 19,969.5 | 24,726.0 | 31,308.7 | 39,643.9 | 50,198.1 | 63,562.2 |
| Depreciation | ||||||||||
| Changes in Account Receivables | ||||||||||
| Changes in Inventories | ||||||||||
| Changes in Accounts Payable | ||||||||||
| Capital Expenditure | ||||||||||
| UFCF | -14,250.9 | 1,047.3 | -1,694.0 | -2,768.7 | 13,222.1 | -1,707.1 | 4,121.8 | 5,219.1 | 6,608.6 | 8,368.0 |
| WACC, % | 5.89 | 5.89 | 5.88 | 5.88 | 5.88 | 5.88 | 5.88 | 5.88 | 5.88 | 5.88 |
| PV UFCF | ||||||||||
| SUM PV UFCF | 18,007.3 | |||||||||
| Long Term Growth Rate, % | 4.00 | |||||||||
| Free cash flow (T + 1) | 8,703 | |||||||||
| Terminal Value | 462,548 | |||||||||
| Present Terminal Value | 347,582 | |||||||||
| Enterprise Value | 365,590 | |||||||||
| Net Debt | 226 | |||||||||
| Equity Value | 365,363 | |||||||||
| Diluted Shares Outstanding, MM | 151 | |||||||||
| Equity Value Per Share | 2,420.04 |
Benefits of Choosing Polycab India Limited (POLYCABNS)
- Authentic POLYCAB Financial Data: Access complete historical and projected figures for precise valuation.
- Customizable Inputs: Adjust parameters such as WACC, tax rates, revenue growth, and capital expenditures.
- Automated Calculations: Dynamic computation of intrinsic value and NPV.
- Scenario Analysis: Evaluate various scenarios to assess Polycab India's future performance.
- User-Friendly Design: Crafted for industry professionals while remaining approachable for newcomers.
Key Features
- Pre-Loaded Data: Historical financial statements and pre-filled forecasts for Polycab India Limited (POLYCABNS).
- Fully Adjustable Inputs: Customize WACC, tax rates, revenue growth, and EBITDA margins as needed.
- Instant Results: Watch the intrinsic value of Polycab India Limited (POLYCABNS) recalculate in real-time.
- Clear Visual Outputs: Dashboard charts present valuation results and essential metrics clearly.
- Built for Accuracy: A robust tool designed for analysts, investors, and finance professionals.
How It Works
- Step 1: Download the Excel file for Polycab India Limited (POLYCABNS).
- Step 2: Review the pre-filled financial data and forecasts for Polycab.
- Step 3: Adjust key inputs such as revenue growth, WACC, and tax rates (highlighted cells).
- Step 4: Observe the DCF model update in real-time as you modify your assumptions.
- Step 5: Evaluate the outputs and leverage the insights for your investment decisions.
Why Opt for This Calculator?
- User-Friendly: Tailored for both novices and seasoned professionals.
- Customizable Inputs: Effortlessly adjust parameters to suit your analysis needs.
- Real-Time Adjustments: Witness immediate updates to Polycab India Limited’s valuation as you change inputs.
- Preconfigured Data: Comes with Polycab’s actual financial figures for swift assessments.
- Favored by Experts: Employed by investors and analysts for informed decision-making.
Who Can Benefit from This Product?
- Finance Students: Master valuation methods and apply them using real-time data.
- Academics: Integrate established models into your teaching or research projects.
- Investors: Validate your assumptions and evaluate the valuation trends for Polycab India Limited (POLYCABNS).
- Analysts: Enhance your efficiency with a customizable, ready-to-use DCF model.
- Small Business Owners: Discover insights into the analytical approaches used for large public companies like Polycab India Limited.
Contents of the Template
- Historical Data: Features Polycab India Limited's past financial performance and baseline forecasts.
- DCF and Levered DCF Models: Comprehensive templates for calculating the intrinsic value of Polycab India Limited.
- WACC Sheet: Pre-designed calculations for the Weighted Average Cost of Capital.
- Editable Inputs: Customize key variables such as growth rates, EBITDA %, and CAPEX assumptions.
- Quarterly and Annual Statements: A thorough analysis of Polycab India Limited's financial reports.
- Interactive Dashboard: Dynamically visualize valuation results and projections.
Disclaimer
All information, articles, and product details provided on this website are for general informational and educational purposes only. We do not claim any ownership over, nor do we intend to infringe upon, any trademarks, copyrights, logos, brand names, or other intellectual property mentioned or depicted on this site. Such intellectual property remains the property of its respective owners, and any references here are made solely for identification or informational purposes, without implying any affiliation, endorsement, or partnership.
We make no representations or warranties, express or implied, regarding the accuracy, completeness, or suitability of any content or products presented. Nothing on this website should be construed as legal, tax, investment, financial, medical, or other professional advice. In addition, no part of this site—including articles or product references—constitutes a solicitation, recommendation, endorsement, advertisement, or offer to buy or sell any securities, franchises, or other financial instruments, particularly in jurisdictions where such activity would be unlawful.
All content is of a general nature and may not address the specific circumstances of any individual or entity. It is not a substitute for professional advice or services. Any actions you take based on the information provided here are strictly at your own risk. You accept full responsibility for any decisions or outcomes arising from your use of this website and agree to release us from any liability in connection with your use of, or reliance upon, the content or products found herein.