
|
Pacific Premier Bancorp, Inc. (PPBI) DCF -Bewertung |
Fully Editable: Tailor To Your Needs In Excel Or Sheets
Professional Design: Trusted, Industry-Standard Templates
Investor-Approved Valuation Models
MAC/PC Compatible, Fully Unlocked
No Expertise Is Needed; Easy To Follow
Pacific Premier Bancorp, Inc. (PPBI) Bundle
Gewinnen Sie mit unserem hochkeitigen DCF-Taschenrechner einen tieferen Einblick in Ihre Pacific Premier Bancorp, Inc. (PPBI) -Schanganalyse! Diese Excel -Vorlage wird mit realen (PPBI) -Daten vorinstalliert, sodass Sie die Vorhersagen und Annahmen für eine genaue Berechnung des intrinsischen Wertes von Pacific Premier Bancorp, Inc. anpassen können.
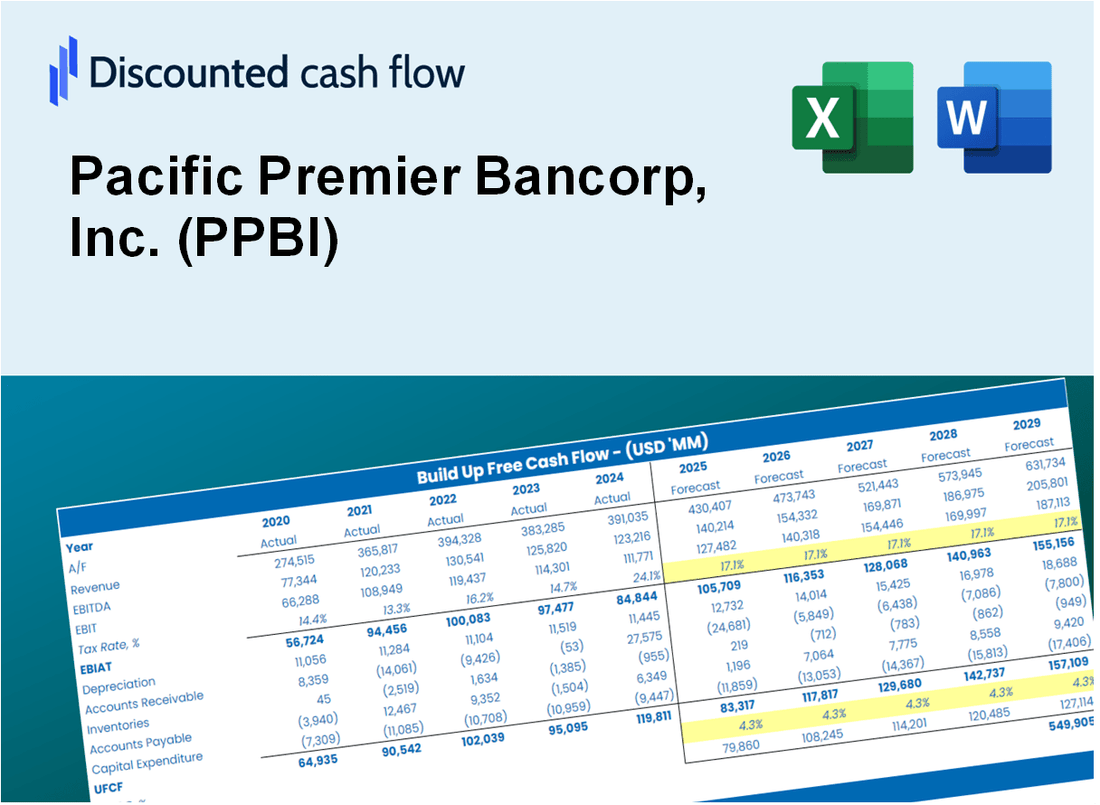
Discounted Cash Flow (DCF) - (USD MM)
| Year | AY1 2020 |
AY2 2021 |
AY3 2022 |
AY4 2023 |
AY5 2024 |
FY1 2025 |
FY2 2026 |
FY3 2027 |
FY4 2028 |
FY5 2029 |
|---|---|---|---|---|---|---|---|---|---|---|
| Revenue | 678.8 | 784.5 | 834.1 | 672.3 | 853.4 | 916.2 | 983.6 | 1,055.9 | 1,133.6 | 1,217.0 |
| Revenue Growth, % | 0 | 15.56 | 6.32 | -19.39 | 26.93 | 7.36 | 7.36 | 7.36 | 7.36 | 7.36 |
| EBITDA | 103.0 | 492.7 | 413.1 | 60.2 | 235.3 | 300.6 | 322.7 | 346.4 | 371.9 | 399.3 |
| EBITDA, % | 15.18 | 62.81 | 49.53 | 8.95 | 27.57 | 32.81 | 32.81 | 32.81 | 32.81 | 32.81 |
| Depreciation | 30.4 | 31.9 | 28.7 | 26.1 | 22.8 | 34.0 | 36.5 | 39.2 | 42.1 | 45.2 |
| Depreciation, % | 4.48 | 4.07 | 3.45 | 3.89 | 2.68 | 3.71 | 3.71 | 3.71 | 3.71 | 3.71 |
| EBIT | 72.6 | 460.8 | 384.4 | 34.0 | 212.5 | 266.6 | 286.2 | 307.2 | 329.8 | 354.1 |
| EBIT, % | 10.7 | 58.74 | 46.08 | 5.06 | 24.9 | 29.1 | 29.1 | 29.1 | 29.1 | 29.1 |
| Total Cash | 4,814.7 | 4,580.8 | 3,704.0 | 2,077.5 | 1,407.1 | 916.2 | 983.6 | 1,055.9 | 1,133.6 | 1,217.0 |
| Total Cash, percent | .0 | .0 | .0 | .0 | .0 | .0 | .0 | .0 | .0 | .0 |
| Account Receivables | 74.6 | 65.7 | 73.8 | 68.5 | 68.0 | 85.0 | 91.2 | 97.9 | 105.1 | 112.8 |
| Account Receivables, % | 10.99 | 8.38 | 8.85 | 10.19 | 7.96 | 9.27 | 9.27 | 9.27 | 9.27 | 9.27 |
| Inventories | .0 | .0 | .0 | .0 | .0 | .0 | .0 | .0 | .0 | .0 |
| Inventories, % | 0 | 0 | 0 | 0 | 0 | 0 | 0 | 0 | 0 | 0 |
| Accounts Payable | .0 | .0 | .0 | .0 | .0 | .0 | .0 | .0 | .0 | .0 |
| Accounts Payable, % | 0 | 0 | 0 | 0 | 0 | 0 | 0 | 0 | 0 | 0 |
| Capital Expenditure | -11.4 | -9.3 | -7.5 | -6.6 | -3.7 | -9.5 | -10.2 | -10.9 | -11.7 | -12.6 |
| Capital Expenditure, % | -1.68 | -1.18 | -0.89633 | -0.98297 | -0.42935 | -1.03 | -1.03 | -1.03 | -1.03 | -1.03 |
| Tax Rate, % | 25.26 | 25.26 | 25.26 | 25.26 | 25.26 | 25.26 | 25.26 | 25.26 | 25.26 | 25.26 |
| EBITAT | 60.4 | 339.9 | 283.7 | 30.9 | 158.8 | 211.2 | 226.7 | 243.4 | 261.3 | 280.5 |
| Depreciation | ||||||||||
| Changes in Account Receivables | ||||||||||
| Changes in Inventories | ||||||||||
| Changes in Accounts Payable | ||||||||||
| Capital Expenditure | ||||||||||
| UFCF | 4.8 | 371.4 | 296.9 | 55.7 | 178.5 | 218.7 | 246.8 | 264.9 | 284.4 | 305.3 |
| WACC, % | 17.27 | 16.24 | 16.25 | 18.1 | 16.35 | 16.84 | 16.84 | 16.84 | 16.84 | 16.84 |
| PV UFCF | ||||||||||
| SUM PV UFCF | 826.9 | |||||||||
| Long Term Growth Rate, % | 2.00 | |||||||||
| Free cash flow (T + 1) | 311 | |||||||||
| Terminal Value | 2,099 | |||||||||
| Present Terminal Value | 964 | |||||||||
| Enterprise Value | 1,791 | |||||||||
| Net Debt | -338 | |||||||||
| Equity Value | 2,129 | |||||||||
| Diluted Shares Outstanding, MM | 95 | |||||||||
| Equity Value Per Share | 22.48 |
What You Will Receive
- Comprehensive Financial Model: Pacific Premier Bancorp, Inc.'s (PPBI) actual data allows for accurate DCF valuation.
- Complete Forecasting Flexibility: Modify revenue growth, profit margins, WACC, and other essential metrics.
- Real-Time Calculations: Instant updates ensure you see the outcomes as adjustments are made.
- Professional-Grade Template: A polished Excel file crafted for high-quality valuation presentations.
- Adaptable and Reusable: Designed for versatility, enabling repeated use for in-depth forecasts.
Key Features
- Comprehensive Financial Data: Access Pacific Premier Bancorp, Inc.'s (PPBI) historical financial statements and projected forecasts.
- Customizable Parameters: Adjust inputs such as WACC, tax rates, revenue growth, and net interest margins.
- Real-Time Valuation: Witness the intrinsic value of Pacific Premier Bancorp, Inc. (PPBI) update instantly.
- Intuitive Visualizations: Interactive dashboard presents valuation results and essential metrics clearly.
- Designed for Precision: A robust tool tailored for analysts, investors, and finance professionals.
How It Works
- Download: Obtain the pre-built Excel file featuring Pacific Premier Bancorp, Inc.'s (PPBI) financial data.
- Customize: Modify forecasts, such as revenue growth, EBITDA %, and WACC.
- Update Automatically: The intrinsic value and NPV calculations refresh in real-time.
- Test Scenarios: Generate various projections and instantly compare the results.
- Make Decisions: Leverage the valuation results to inform your investment strategy.
Why Choose This Calculator for Pacific Premier Bancorp, Inc. (PPBI)?
- Accuracy: Utilizes real Pacific Premier financials to ensure precise data.
- Flexibility: Built for users to easily test and adjust inputs as needed.
- Time-Saving: Avoid the complexity of constructing a DCF model from the ground up.
- Professional-Grade: Crafted with the precision and usability expected at the CFO level.
- User-Friendly: Intuitive interface designed for users without extensive financial modeling expertise.
Who Should Use This Product?
- Investors: Evaluate Pacific Premier Bancorp, Inc.'s (PPBI) financial health before making investment decisions.
- CFOs and Financial Analysts: Optimize valuation methods and assess forecasts for better financial planning.
- Startup Founders: Understand the valuation practices of established financial institutions like Pacific Premier Bancorp, Inc. (PPBI).
- Consultants: Provide expert valuation insights and reports for clients in the banking sector.
- Students and Educators: Utilize authentic data to enhance learning and teaching of valuation strategies.
What the Template Contains
- Historical Data: Includes Pacific Premier Bancorp, Inc.'s (PPBI) past financials and baseline forecasts.
- DCF and Levered DCF Models: Detailed templates to calculate Pacific Premier Bancorp, Inc.'s (PPBI) intrinsic value.
- WACC Sheet: Pre-built calculations for Weighted Average Cost of Capital.
- Editable Inputs: Modify key drivers like growth rates, EBITDA %, and CAPEX assumptions.
- Quarterly and Annual Statements: A complete breakdown of Pacific Premier Bancorp, Inc.'s (PPBI) financials.
- Interactive Dashboard: Visualize valuation results and projections dynamically.
Disclaimer
All information, articles, and product details provided on this website are for general informational and educational purposes only. We do not claim any ownership over, nor do we intend to infringe upon, any trademarks, copyrights, logos, brand names, or other intellectual property mentioned or depicted on this site. Such intellectual property remains the property of its respective owners, and any references here are made solely for identification or informational purposes, without implying any affiliation, endorsement, or partnership.
We make no representations or warranties, express or implied, regarding the accuracy, completeness, or suitability of any content or products presented. Nothing on this website should be construed as legal, tax, investment, financial, medical, or other professional advice. In addition, no part of this site—including articles or product references—constitutes a solicitation, recommendation, endorsement, advertisement, or offer to buy or sell any securities, franchises, or other financial instruments, particularly in jurisdictions where such activity would be unlawful.
All content is of a general nature and may not address the specific circumstances of any individual or entity. It is not a substitute for professional advice or services. Any actions you take based on the information provided here are strictly at your own risk. You accept full responsibility for any decisions or outcomes arising from your use of this website and agree to release us from any liability in connection with your use of, or reliance upon, the content or products found herein.