
|
Praj Industries Limited (Prajind.NS) DCF -Bewertung |
Fully Editable: Tailor To Your Needs In Excel Or Sheets
Professional Design: Trusted, Industry-Standard Templates
Investor-Approved Valuation Models
MAC/PC Compatible, Fully Unlocked
No Expertise Is Needed; Easy To Follow
Praj Industries Limited (PRAJIND.NS) Bundle
Entdecken Sie das wahre Potenzial von Praj Industries Limited mit unserem fortschrittlichen DCF -Taschenrechner! Passen Sie die wichtigsten Annahmen an, erkunden Sie verschiedene Szenarien und bewerten Sie, wie sich Änderungen auf die Bewertung von Praj Industries Limited auswirken-alles innerhalb einer benutzerfreundlichen Excel-Vorlage.
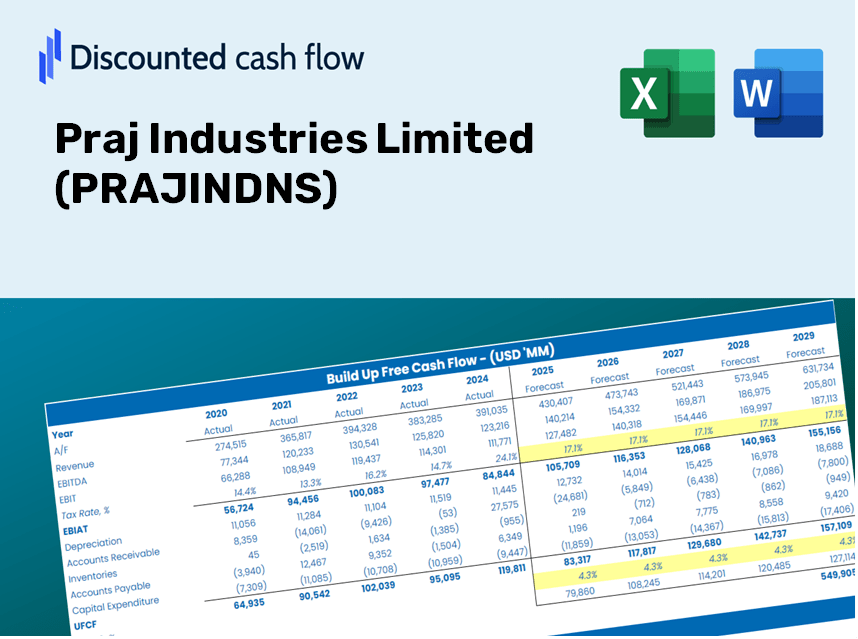
Discounted Cash Flow (DCF) - (USD MM)
| Year | AY1 2021 |
AY2 2022 |
AY3 2023 |
AY4 2024 |
AY5 2025 |
FY1 2026 |
FY2 2027 |
FY3 2028 |
FY4 2029 |
FY5 2030 |
|---|---|---|---|---|---|---|---|---|---|---|
| Revenue | 13,046.7 | 23,432.7 | 35,280.4 | 34,662.8 | 32,280.4 | 42,089.1 | 54,878.3 | 71,553.5 | 93,295.7 | 121,644.4 |
| Revenue Growth, % | 0 | 79.61 | 50.56 | -1.75 | -6.87 | 30.39 | 30.39 | 30.39 | 30.39 | 30.39 |
| EBITDA | 1,373.9 | 2,294.0 | 3,531.4 | 4,313.1 | 3,148.8 | 4,421.7 | 5,765.2 | 7,517.0 | 9,801.2 | 12,779.3 |
| EBITDA, % | 10.53 | 9.79 | 10.01 | 12.44 | 9.75 | 10.51 | 10.51 | 10.51 | 10.51 | 10.51 |
| Depreciation | 221.2 | 225.9 | 302.5 | 440.6 | 864.4 | 628.5 | 819.4 | 1,068.4 | 1,393.1 | 1,816.3 |
| Depreciation, % | 1.7 | 0.96409 | 0.85733 | 1.27 | 2.68 | 1.49 | 1.49 | 1.49 | 1.49 | 1.49 |
| EBIT | 1,152.7 | 2,068.1 | 3,228.9 | 3,872.5 | 2,284.4 | 3,793.2 | 4,945.8 | 6,448.6 | 8,408.1 | 10,963.0 |
| EBIT, % | 8.84 | 8.83 | 9.15 | 11.17 | 7.08 | 9.01 | 9.01 | 9.01 | 9.01 | 9.01 |
| Total Cash | 4,263.6 | 5,518.9 | 6,021.6 | 6,137.2 | 5,395.9 | 9,067.8 | 11,823.1 | 15,415.7 | 20,099.9 | 26,207.4 |
| Total Cash, percent | .0 | .0 | .0 | .0 | .0 | .0 | .0 | .0 | .0 | .0 |
| Account Receivables | 5,913.4 | 8,165.5 | 11,204.2 | 12,465.9 | 5,559.9 | 13,899.1 | 18,122.5 | 23,629.2 | 30,809.1 | 40,170.8 |
| Account Receivables, % | 45.32 | 34.85 | 31.76 | 35.96 | 17.22 | 33.02 | 33.02 | 33.02 | 33.02 | 33.02 |
| Inventories | 1,289.1 | 3,450.3 | 3,336.2 | 2,549.4 | 2,533.1 | 4,146.9 | 5,407.0 | 7,050.0 | 9,192.2 | 11,985.3 |
| Inventories, % | 9.88 | 14.72 | 9.46 | 7.35 | 7.85 | 9.85 | 9.85 | 9.85 | 9.85 | 9.85 |
| Accounts Payable | 3,416.1 | 4,247.9 | 5,050.2 | 4,967.6 | 4,822.9 | 7,399.1 | 9,647.4 | 12,578.8 | 16,401.0 | 21,384.6 |
| Accounts Payable, % | 26.18 | 18.13 | 14.31 | 14.33 | 14.94 | 17.58 | 17.58 | 17.58 | 17.58 | 17.58 |
| Capital Expenditure | -86.7 | -185.1 | -353.1 | -892.7 | -870.4 | -650.5 | -848.1 | -1,105.8 | -1,441.9 | -1,880.0 |
| Capital Expenditure, % | -0.66459 | -0.79007 | -1 | -2.58 | -2.7 | -1.55 | -1.55 | -1.55 | -1.55 | -1.55 |
| Tax Rate, % | 26.68 | 26.68 | 26.68 | 26.68 | 26.68 | 26.68 | 26.68 | 26.68 | 26.68 | 26.68 |
| EBITAT | 826.0 | 1,516.5 | 2,429.3 | 2,907.0 | 1,675.0 | 2,796.5 | 3,646.2 | 4,754.1 | 6,198.7 | 8,082.3 |
| Depreciation | ||||||||||
| Changes in Account Receivables | ||||||||||
| Changes in Inventories | ||||||||||
| Changes in Accounts Payable | ||||||||||
| Capital Expenditure | ||||||||||
| UFCF | -2,825.9 | -2,024.2 | 256.2 | 1,897.4 | 8,446.6 | -4,602.4 | 382.3 | 498.5 | 650.0 | 847.5 |
| WACC, % | 4.9 | 4.91 | 4.91 | 4.91 | 4.91 | 4.91 | 4.91 | 4.91 | 4.91 | 4.91 |
| PV UFCF | ||||||||||
| SUM PV UFCF | -2,404.4 | |||||||||
| Long Term Growth Rate, % | 4.00 | |||||||||
| Free cash flow (T + 1) | 881 | |||||||||
| Terminal Value | 97,242 | |||||||||
| Present Terminal Value | 76,532 | |||||||||
| Enterprise Value | 74,128 | |||||||||
| Net Debt | 137 | |||||||||
| Equity Value | 73,991 | |||||||||
| Diluted Shares Outstanding, MM | 184 | |||||||||
| Equity Value Per Share | 402.55 |
What You Will Receive
- Authentic Praj Data: Preloaded financial metrics – encompassing revenue to EBIT – drawn from actual and projected figures.
- Comprehensive Customization: Modify key variables (yellow cells) such as WACC, growth rate, and tax percentages.
- Real-Time Valuation Adjustments: Automatic updates to evaluate how changes affect Praj Industries Limited's fair value.
- Flexible Excel Template: Designed for quick modifications, scenario evaluations, and in-depth forecasting.
- Efficient and Precise: Avoid the hassle of building models from the ground up while ensuring accuracy and adaptability.
Key Features
- Comprehensive DCF Calculator: Features detailed unlevered and levered DCF valuation models tailored for Praj Industries Limited (PRAJINDNS).
- WACC Calculator: Comes with a pre-configured Weighted Average Cost of Capital sheet that allows for customizable inputs.
- Modifiable Forecast Assumptions: Easily adjust growth rates, capital expenditures, and discount rates to fit your analysis.
- Integrated Financial Ratios: Assess profitability, leverage, and efficiency ratios specifically for Praj Industries Limited (PRAJINDNS).
- Interactive Dashboard and Charts: Visual representations that summarize essential valuation metrics for straightforward analysis.
How It Works
- Step 1: Download the Excel file for Praj Industries Limited (PRAJINDNS).
- Step 2: Examine the pre-filled financial data and projections for Praj Industries.
- Step 3: Adjust key inputs such as revenue growth, WACC, and tax rates (highlighted cells).
- Step 4: Observe the DCF model refresh instantly as you modify your assumptions.
- Step 5: Evaluate the outputs and leverage the findings for your investment strategies.
Why Select This Calculator?
- Designed for Professionals: A sophisticated tool tailored for analysts, CFOs, and consultants.
- Accurate Financial Data: Praj Industries Limited’s historical and projected financial information is preloaded for precision.
- Scenario Analysis: Effortlessly simulate various forecasts and assumptions.
- Clear Results: Instantly calculates intrinsic value, NPV, and other important metrics.
- User-Friendly Interface: Step-by-step guidance simplifies the entire process.
Who Should Benefit from Our Product?
- Institutional Investors: Develop comprehensive and accurate valuation models for portfolio assessment of Praj Industries Limited (PRAJINDNS).
- Corporate Finance Departments: Evaluate valuation scenarios to inform strategic decisions within their organizations.
- Consultants and Financial Advisors: Equip clients with precise valuation analysis for Praj Industries Limited (PRAJINDNS) stock.
- Academic Students and Instructors: Utilize real-time data to enhance learning and practice in financial modeling.
- Industry Enthusiasts: Gain insights into the market valuation of innovative companies like Praj Industries Limited (PRAJINDNS).
What the Template Includes
- Historical Data: Contains Praj Industries Limited's (PRAJINDNS) previous financials and foundational forecasts.
- DCF and Levered DCF Models: Comprehensive templates designed to assess Praj Industries Limited’s (PRAJINDNS) intrinsic value.
- WACC Sheet: Pre-configured calculations for Weighted Average Cost of Capital.
- Editable Inputs: Adjust essential drivers such as growth rates, EBITDA percentages, and CAPEX projections.
- Quarterly and Annual Statements: An extensive overview of Praj Industries Limited’s (PRAJINDNS) financial performance.
- Interactive Dashboard: Dynamically visualize valuation results and future projections.
Disclaimer
All information, articles, and product details provided on this website are for general informational and educational purposes only. We do not claim any ownership over, nor do we intend to infringe upon, any trademarks, copyrights, logos, brand names, or other intellectual property mentioned or depicted on this site. Such intellectual property remains the property of its respective owners, and any references here are made solely for identification or informational purposes, without implying any affiliation, endorsement, or partnership.
We make no representations or warranties, express or implied, regarding the accuracy, completeness, or suitability of any content or products presented. Nothing on this website should be construed as legal, tax, investment, financial, medical, or other professional advice. In addition, no part of this site—including articles or product references—constitutes a solicitation, recommendation, endorsement, advertisement, or offer to buy or sell any securities, franchises, or other financial instruments, particularly in jurisdictions where such activity would be unlawful.
All content is of a general nature and may not address the specific circumstances of any individual or entity. It is not a substitute for professional advice or services. Any actions you take based on the information provided here are strictly at your own risk. You accept full responsibility for any decisions or outcomes arising from your use of this website and agree to release us from any liability in connection with your use of, or reliance upon, the content or products found herein.