
|
DCF -Bewertung von SCHUPIO, Inc. (PRPO) |
Fully Editable: Tailor To Your Needs In Excel Or Sheets
Professional Design: Trusted, Industry-Standard Templates
Investor-Approved Valuation Models
MAC/PC Compatible, Fully Unlocked
No Expertise Is Needed; Easy To Follow
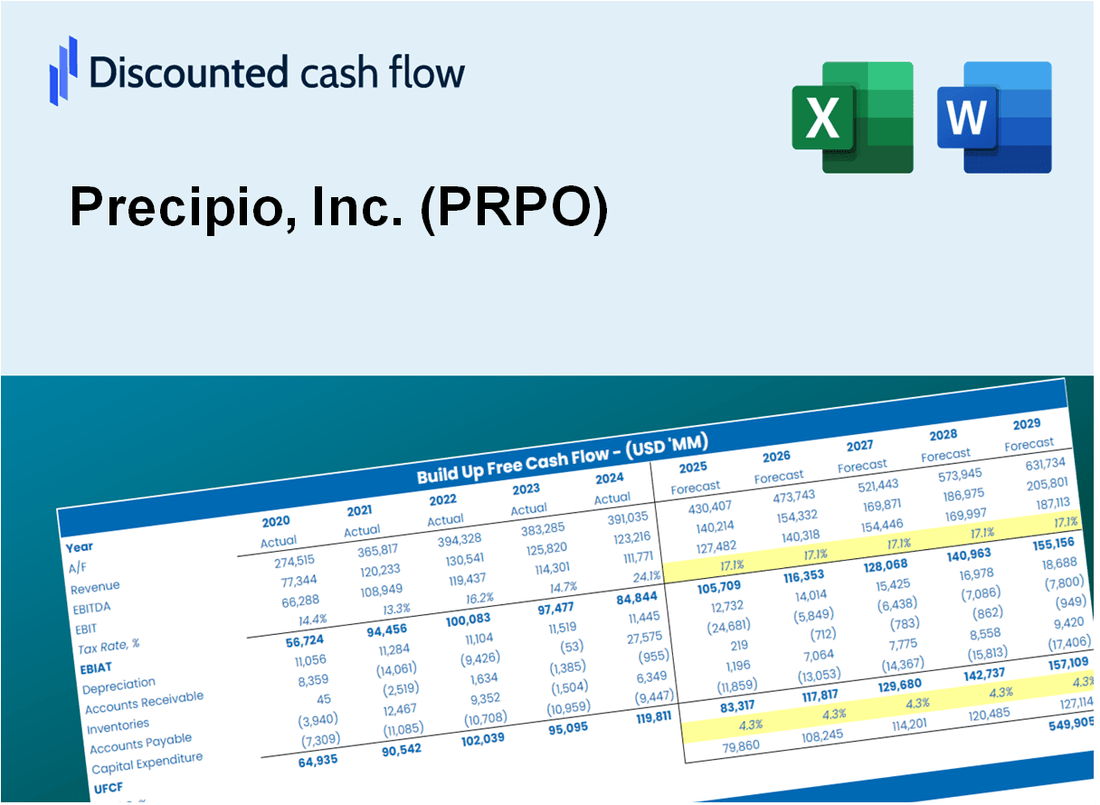
Precipio, Inc. (PRPO) Bundle
Als Anleger oder Analyst ist dieser (PRPO) DCF-Taschenrechner Ihre Anlaufstelle für eine genaue Bewertung. Mit realen Daten aus dem Eingeladenen von CHIPIO, Inc. können Sie Prognosen anpassen und die Auswirkungen sofort beobachten.
Discounted Cash Flow (DCF) - (USD MM)
| Year | AY1 2020 |
AY2 2021 |
AY3 2022 |
AY4 2023 |
AY5 2024 |
FY1 2025 |
FY2 2026 |
FY3 2027 |
FY4 2028 |
FY5 2029 |
|---|---|---|---|---|---|---|---|---|---|---|
| Revenue | 6.1 | 8.8 | 9.4 | 15.2 | 16.0 | 20.7 | 26.8 | 34.7 | 44.9 | 58.2 |
| Revenue Growth, % | 0 | 45.26 | 6.36 | 61.46 | 5.05 | 29.53 | 29.53 | 29.53 | 29.53 | 29.53 |
| EBITDA | -8.8 | -7.1 | -10.6 | -4.3 | -2.7 | -13.4 | -17.4 | -22.6 | -29.2 | -37.9 |
| EBITDA, % | -143.99 | -79.7 | -113.11 | -28.41 | -16.93 | -65.01 | -65.01 | -65.01 | -65.01 | -65.01 |
| Depreciation | 1.4 | 1.4 | 1.5 | 1.5 | 1.5 | 3.1 | 4.0 | 5.1 | 6.7 | 8.6 |
| Depreciation, % | 22.26 | 16.32 | 16.15 | 9.98 | 9.48 | 14.84 | 14.84 | 14.84 | 14.84 | 14.84 |
| EBIT | -10.1 | -8.5 | -12.2 | -5.8 | -4.2 | -14.9 | -19.3 | -25.0 | -32.4 | -42.0 |
| EBIT, % | -166.25 | -96.02 | -129.26 | -38.4 | -26.41 | -72.17 | -72.17 | -72.17 | -72.17 | -72.17 |
| Total Cash | 2.7 | 11.7 | 3.4 | 1.5 | 1.4 | 8.2 | 10.6 | 13.8 | 17.9 | 23.1 |
| Total Cash, percent | .0 | .0 | .0 | .0 | .0 | .0 | .0 | .0 | .0 | .0 |
| Account Receivables | .9 | .7 | 1.0 | 1.3 | .8 | 1.9 | 2.5 | 3.2 | 4.2 | 5.4 |
| Account Receivables, % | 14.35 | 7.88 | 11.01 | 8.56 | 5 | 9.36 | 9.36 | 9.36 | 9.36 | 9.36 |
| Inventories | .4 | .6 | .7 | .4 | .7 | 1.1 | 1.4 | 1.9 | 2.4 | 3.1 |
| Inventories, % | 5.75 | 6.37 | 7.52 | 2.53 | 4.53 | 5.34 | 5.34 | 5.34 | 5.34 | 5.34 |
| Accounts Payable | 1.7 | 1.9 | 2.0 | .6 | .6 | 3.2 | 4.2 | 5.4 | 7.1 | 9.1 |
| Accounts Payable, % | 27.79 | 21.05 | 21.7 | 4.09 | 3.87 | 15.7 | 15.7 | 15.7 | 15.7 | 15.7 |
| Capital Expenditure | -.2 | -.7 | -.3 | -.1 | -.2 | -.6 | -.8 | -1.1 | -1.4 | -1.8 |
| Capital Expenditure, % | -2.48 | -7.71 | -2.94 | -0.82911 | -1.4 | -3.07 | -3.07 | -3.07 | -3.07 | -3.07 |
| Tax Rate, % | 0 | 0 | 0 | 0 | 0 | 0 | 0 | 0 | 0 | 0 |
| EBITAT | -11.7 | -8.5 | -12.2 | -5.8 | -4.2 | -14.9 | -19.3 | -25.0 | -32.4 | -42.0 |
| Depreciation | ||||||||||
| Changes in Account Receivables | ||||||||||
| Changes in Inventories | ||||||||||
| Changes in Accounts Payable | ||||||||||
| Capital Expenditure | ||||||||||
| UFCF | -10.0 | -7.6 | -11.3 | -5.8 | -2.8 | -11.4 | -16.1 | -20.9 | -27.0 | -35.0 |
| WACC, % | 9.04 | 9.04 | 9.04 | 9.04 | 9.04 | 9.04 | 9.04 | 9.04 | 9.04 | 9.04 |
| PV UFCF | ||||||||||
| SUM PV UFCF | -81.9 | |||||||||
| Long Term Growth Rate, % | 2.00 | |||||||||
| Free cash flow (T + 1) | -36 | |||||||||
| Terminal Value | -507 | |||||||||
| Present Terminal Value | -329 | |||||||||
| Enterprise Value | -411 | |||||||||
| Net Debt | 0 | |||||||||
| Equity Value | -411 | |||||||||
| Diluted Shares Outstanding, MM | 1 | |||||||||
| Equity Value Per Share | -280.43 |
What You Will Receive
- Comprehensive Financial Model: Precipio’s actual data facilitates accurate DCF valuation.
- Complete Forecast Control: Modify revenue growth, margins, WACC, and other essential metrics.
- Real-Time Calculations: Automatic updates provide immediate results as you adjust inputs.
- Professional-Grade Template: A polished Excel file crafted for high-quality valuation.
- Flexible and Reusable: Designed for adaptability, allowing for repeated use in detailed forecasting.
Key Features
- 🔍 Real-Life PRPO Financials: Pre-filled historical and projected data for Precipio, Inc.
- ✏️ Fully Customizable Inputs: Adjust all critical parameters (yellow cells) like WACC, growth %, and tax rates.
- 📊 Professional DCF Valuation: Built-in formulas calculate Precipio’s intrinsic value using the Discounted Cash Flow method.
- ⚡ Instant Results: Visualize Precipio’s valuation instantly after making changes.
- Scenario Analysis: Test and compare outcomes for various financial assumptions side-by-side.
How It Works
- Step 1: Download the prebuilt Excel template featuring Precipio, Inc. (PRPO) data.
- Step 2: Navigate through the pre-filled sheets to familiarize yourself with the essential metrics.
- Step 3: Modify forecasts and assumptions in the editable yellow cells (WACC, growth, margins).
- Step 4: Instantly access recalculated results, including Precipio, Inc.'s (PRPO) intrinsic value.
- Step 5: Utilize the outputs to make informed investment decisions or create comprehensive reports.
Why Choose Precipio's Calculator?
- All-in-One Solution: Offers DCF, WACC, and comprehensive financial ratio analyses seamlessly integrated.
- Flexible Inputs: Modify the highlighted cells to explore different financial scenarios.
- In-Depth Analysis: Automatically computes Precipio's intrinsic value and Net Present Value.
- Preloaded Information: Access to historical and projected data for reliable calculations.
- Expert-Level Tool: Perfect for financial analysts, investors, and business advisors.
Who Should Use Precipio, Inc. (PRPO)?
- Healthcare Investors: Develop comprehensive valuation models for assessing investment opportunities in biotech.
- Corporate Strategy Teams: Evaluate market scenarios to inform strategic decisions within the healthcare sector.
- Financial Consultants: Deliver precise valuation analyses to clients interested in Precipio, Inc. (PRPO).
- Academics and Students: Utilize current data to enhance learning and teaching in financial analysis.
- Market Analysts: Gain insights into how biotech firms like Precipio, Inc. (PRPO) are valued in the investment landscape.
What the Template Contains
- Pre-Filled Data: Includes Precipio, Inc.'s historical financials and forecasts.
- Discounted Cash Flow Model: Editable DCF valuation model with automatic calculations.
- Weighted Average Cost of Capital (WACC): A dedicated sheet for calculating WACC based on custom inputs.
- Key Financial Ratios: Analyze Precipio, Inc.'s profitability, efficiency, and leverage.
- Customizable Inputs: Edit revenue growth, margins, and tax rates with ease.
- Clear Dashboard: Charts and tables summarizing key valuation results.
Disclaimer
All information, articles, and product details provided on this website are for general informational and educational purposes only. We do not claim any ownership over, nor do we intend to infringe upon, any trademarks, copyrights, logos, brand names, or other intellectual property mentioned or depicted on this site. Such intellectual property remains the property of its respective owners, and any references here are made solely for identification or informational purposes, without implying any affiliation, endorsement, or partnership.
We make no representations or warranties, express or implied, regarding the accuracy, completeness, or suitability of any content or products presented. Nothing on this website should be construed as legal, tax, investment, financial, medical, or other professional advice. In addition, no part of this site—including articles or product references—constitutes a solicitation, recommendation, endorsement, advertisement, or offer to buy or sell any securities, franchises, or other financial instruments, particularly in jurisdictions where such activity would be unlawful.
All content is of a general nature and may not address the specific circumstances of any individual or entity. It is not a substitute for professional advice or services. Any actions you take based on the information provided here are strictly at your own risk. You accept full responsibility for any decisions or outcomes arising from your use of this website and agree to release us from any liability in connection with your use of, or reliance upon, the content or products found herein.