
|
Privia Health Group, Inc. (PRVA) DCF -Bewertung |
Fully Editable: Tailor To Your Needs In Excel Or Sheets
Professional Design: Trusted, Industry-Standard Templates
Investor-Approved Valuation Models
MAC/PC Compatible, Fully Unlocked
No Expertise Is Needed; Easy To Follow
Privia Health Group, Inc. (PRVA) Bundle
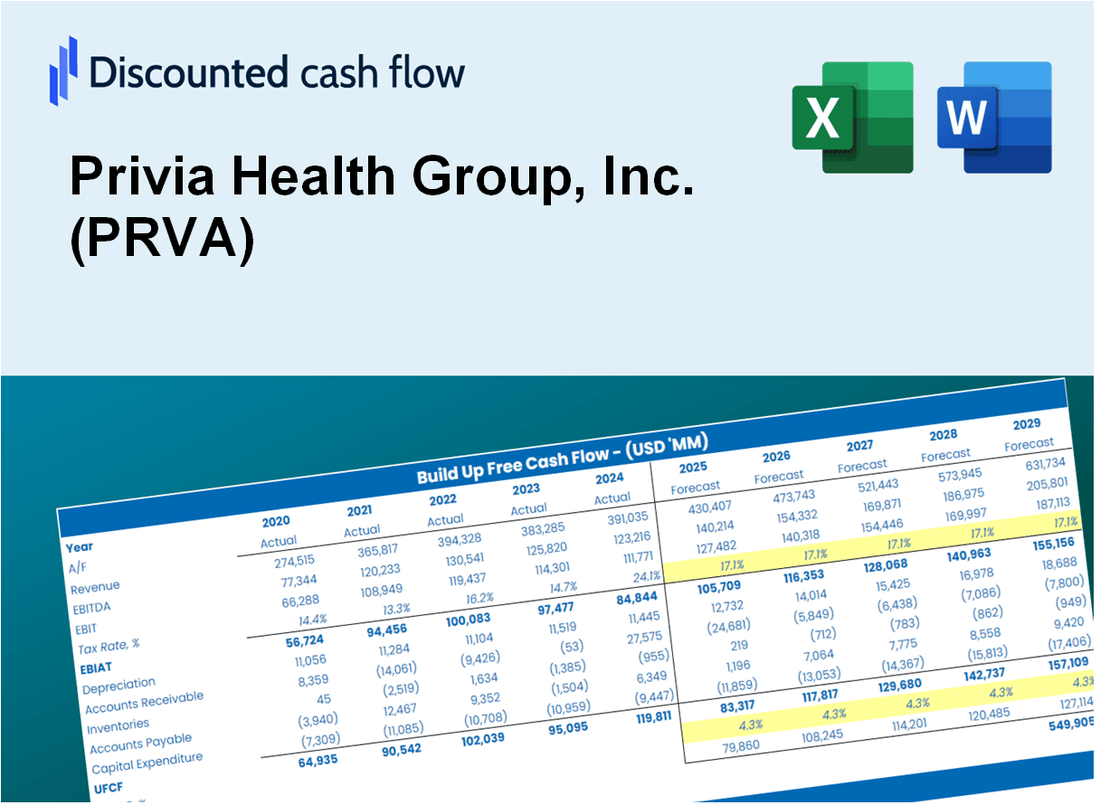
Erwerben Sie mit unserem ausgefeilten DCF -Taschenrechner die Bewertungsanalyse für Ihre Privia Health Group, Inc. (PRVA)! Diese Excel -Vorlage mit realen PRVA -Daten ermöglicht es Ihnen, Prognosen und Annahmen anzupassen, um den inneren Wert der Privia Health Group, Inc. (PRVA) genau zu berechnen.
Discounted Cash Flow (DCF) - (USD MM)
| Year | AY1 2020 |
AY2 2021 |
AY3 2022 |
AY4 2023 |
AY5 2024 |
FY1 2025 |
FY2 2026 |
FY3 2027 |
FY4 2028 |
FY5 2029 |
|---|---|---|---|---|---|---|---|---|---|---|
| Revenue | 817.1 | 966.2 | 1,356.7 | 1,657.7 | 1,736.4 | 2,108.0 | 2,559.1 | 3,106.7 | 3,771.6 | 4,578.7 |
| Revenue Growth, % | 0 | 18.25 | 40.41 | 22.19 | 4.74 | 21.4 | 21.4 | 21.4 | 21.4 | 21.4 |
| EBITDA | 27.2 | -215.0 | -14.6 | 27.2 | 24.3 | -71.5 | -86.8 | -105.3 | -127.9 | -155.2 |
| EBITDA, % | 3.33 | -22.25 | -1.07 | 1.64 | 1.4 | -3.39 | -3.39 | -3.39 | -3.39 | -3.39 |
| Depreciation | 1.8 | 2.5 | 4.6 | 6.5 | 7.3 | 6.9 | 8.3 | 10.1 | 12.3 | 14.9 |
| Depreciation, % | 0.22556 | 0.25501 | 0.33693 | 0.39409 | 0.41857 | 0.32603 | 0.32603 | 0.32603 | 0.32603 | 0.32603 |
| EBIT | 25.4 | -217.4 | -19.1 | 20.6 | 17.0 | -78.3 | -95.1 | -115.5 | -140.2 | -170.2 |
| EBIT, % | 3.11 | -22.5 | -1.41 | 1.25 | 0.97801 | -3.72 | -3.72 | -3.72 | -3.72 | -3.72 |
| Total Cash | 84.6 | 320.6 | 348.0 | 389.5 | 491.1 | 510.0 | 619.1 | 751.6 | 912.5 | 1,107.8 |
| Total Cash, percent | .0 | .0 | .0 | .0 | .0 | .0 | .0 | .0 | .0 | .0 |
| Account Receivables | 99.1 | 117.4 | 189.6 | 290.8 | 316.2 | 312.0 | 378.8 | 459.8 | 558.2 | 677.7 |
| Account Receivables, % | 12.13 | 12.15 | 13.98 | 17.54 | 18.21 | 14.8 | 14.8 | 14.8 | 14.8 | 14.8 |
| Inventories | .0 | .0 | .0 | .0 | .0 | .0 | .0 | .0 | .0 | .0 |
| Inventories, % | 0 | 0 | 0 | 0 | 0 | 0 | 0 | 0 | 0 | 0 |
| Accounts Payable | 5.2 | 3.0 | 6.7 | 7.9 | 9.8 | 10.5 | 12.7 | 15.4 | 18.7 | 22.7 |
| Accounts Payable, % | 0.6407 | 0.30769 | 0.49614 | 0.47547 | 0.5618 | 0.49636 | 0.49636 | 0.49636 | 0.49636 | 0.49636 |
| Capital Expenditure | -.4 | -.5 | -.1 | -.1 | .0 | -.5 | -.6 | -.7 | -.9 | -1.1 |
| Capital Expenditure, % | -0.04650736 | -0.05661237 | -0.00766589 | -0.00681652 | 0 | -0.02352043 | -0.02352043 | -0.02352043 | -0.02352043 | -0.02352043 |
| Tax Rate, % | 48.39 | 48.39 | 48.39 | 48.39 | 48.39 | 48.39 | 48.39 | 48.39 | 48.39 | 48.39 |
| EBITAT | 33.8 | -189.7 | -12.4 | 16.4 | 8.8 | -60.1 | -72.9 | -88.5 | -107.5 | -130.5 |
| Depreciation | ||||||||||
| Changes in Account Receivables | ||||||||||
| Changes in Inventories | ||||||||||
| Changes in Accounts Payable | ||||||||||
| Capital Expenditure | ||||||||||
| UFCF | -58.6 | -208.3 | -76.4 | -77.2 | -7.5 | -48.8 | -129.7 | -157.5 | -191.2 | -232.1 |
| WACC, % | 7.53 | 7.53 | 7.53 | 7.53 | 7.53 | 7.53 | 7.53 | 7.53 | 7.53 | 7.53 |
| PV UFCF | ||||||||||
| SUM PV UFCF | -588.7 | |||||||||
| Long Term Growth Rate, % | 3.00 | |||||||||
| Free cash flow (T + 1) | -239 | |||||||||
| Terminal Value | -5,279 | |||||||||
| Present Terminal Value | -3,673 | |||||||||
| Enterprise Value | -4,261 | |||||||||
| Net Debt | -486 | |||||||||
| Equity Value | -3,776 | |||||||||
| Diluted Shares Outstanding, MM | 126 | |||||||||
| Equity Value Per Share | -30.06 |
What You Will Get
- Real Privia Health Data: Preloaded financials – from revenue to EBIT – based on actual and projected figures for Privia Health Group, Inc. (PRVA).
- Full Customization: Adjust all critical parameters (yellow cells) like WACC, growth %, and tax rates specifically for Privia Health Group, Inc. (PRVA).
- Instant Valuation Updates: Automatic recalculations to analyze the impact of changes on Privia Health Group, Inc.'s fair value.
- Versatile Excel Template: Tailored for quick edits, scenario testing, and detailed projections for Privia Health Group, Inc. (PRVA).
- Time-Saving and Accurate: Skip building models from scratch while maintaining precision and flexibility for Privia Health Group, Inc. (PRVA).
Key Features
- Comprehensive DCF Model: Features detailed unlevered and levered DCF valuation frameworks tailored for Privia Health Group, Inc. (PRVA).
- WACC Analysis Tool: A pre-configured Weighted Average Cost of Capital sheet with adjustable parameters for precise calculations.
- Customizable Forecast Inputs: Alter growth projections, capital investments, and discount rates to fit your analysis needs.
- Integrated Financial Metrics: Evaluate profitability, leverage, and efficiency ratios specifically for Privia Health Group, Inc. (PRVA).
- Interactive Dashboard and Visualizations: Graphical representations that highlight essential valuation metrics for straightforward interpretation.
How It Works
- Step 1: Download the prebuilt Excel template featuring Privia Health Group, Inc. (PRVA) data.
- Step 2: Navigate through the pre-filled sheets to grasp the essential metrics.
- Step 3: Modify forecasts and assumptions in the editable yellow cells (WACC, growth, margins).
- Step 4: Instantly see the updated results, including Privia Health Group, Inc.'s (PRVA) intrinsic value.
- Step 5: Make well-informed investment choices or create reports based on the outputs.
Why Choose This Calculator for Privia Health Group, Inc. (PRVA)?
- Accuracy: Utilizes real Privia financial data to ensure precise calculations.
- Flexibility: Allows users to easily test and adjust inputs as needed.
- Time-Saving: Avoid the complexity of constructing a financial model from the ground up.
- Professional-Grade: Crafted with the expertise and usability expected by CFOs.
- User-Friendly: Intuitive design makes it accessible for users without extensive financial modeling skills.
Who Should Use This Product?
- Healthcare Professionals: Enhance your understanding of value-based care and patient outcomes.
- Researchers: Utilize advanced models for analyzing healthcare data and trends.
- Investors: Evaluate your investment strategies and assess the performance of Privia Health Group, Inc. (PRVA).
- Policy Makers: Analyze the impact of healthcare policies on company performance and patient care.
- Healthcare Administrators: Discover best practices in managing healthcare operations and improving efficiency.
What the Template Contains
- Preloaded PRVA Data: Historical and projected financial data, including revenue, EBIT, and capital expenditures.
- DCF and WACC Models: Professional-grade sheets for calculating intrinsic value and Weighted Average Cost of Capital.
- Editable Inputs: Yellow-highlighted cells for adjusting revenue growth, tax rates, and discount rates.
- Financial Statements: Comprehensive annual and quarterly financials for deeper analysis.
- Key Ratios: Profitability, leverage, and efficiency ratios to evaluate performance.
- Dashboard and Charts: Visual summaries of valuation outcomes and assumptions.
Disclaimer
All information, articles, and product details provided on this website are for general informational and educational purposes only. We do not claim any ownership over, nor do we intend to infringe upon, any trademarks, copyrights, logos, brand names, or other intellectual property mentioned or depicted on this site. Such intellectual property remains the property of its respective owners, and any references here are made solely for identification or informational purposes, without implying any affiliation, endorsement, or partnership.
We make no representations or warranties, express or implied, regarding the accuracy, completeness, or suitability of any content or products presented. Nothing on this website should be construed as legal, tax, investment, financial, medical, or other professional advice. In addition, no part of this site—including articles or product references—constitutes a solicitation, recommendation, endorsement, advertisement, or offer to buy or sell any securities, franchises, or other financial instruments, particularly in jurisdictions where such activity would be unlawful.
All content is of a general nature and may not address the specific circumstances of any individual or entity. It is not a substitute for professional advice or services. Any actions you take based on the information provided here are strictly at your own risk. You accept full responsibility for any decisions or outcomes arising from your use of this website and agree to release us from any liability in connection with your use of, or reliance upon, the content or products found herein.