
|
DCF -Bewertung von Polestar Automotive Holding UK (PSNY) |
Fully Editable: Tailor To Your Needs In Excel Or Sheets
Professional Design: Trusted, Industry-Standard Templates
Investor-Approved Valuation Models
MAC/PC Compatible, Fully Unlocked
No Expertise Is Needed; Easy To Follow
Polestar Automotive Holding UK PLC (PSNY) Bundle
Entdecken Sie das wahre Potenzial von Polestar Automotive Holding UK Plc (PSNY) mit unserem fortschrittlichen DCF -Taschenrechner! Passen Sie kritische Annahmen an, erkunden Sie verschiedene Szenarien und untersuchen Sie die Auswirkungen von Änderungen auf die Bewertung von Polestar-alles innerhalb einer benutzerfreundlichen Excel-Vorlage.
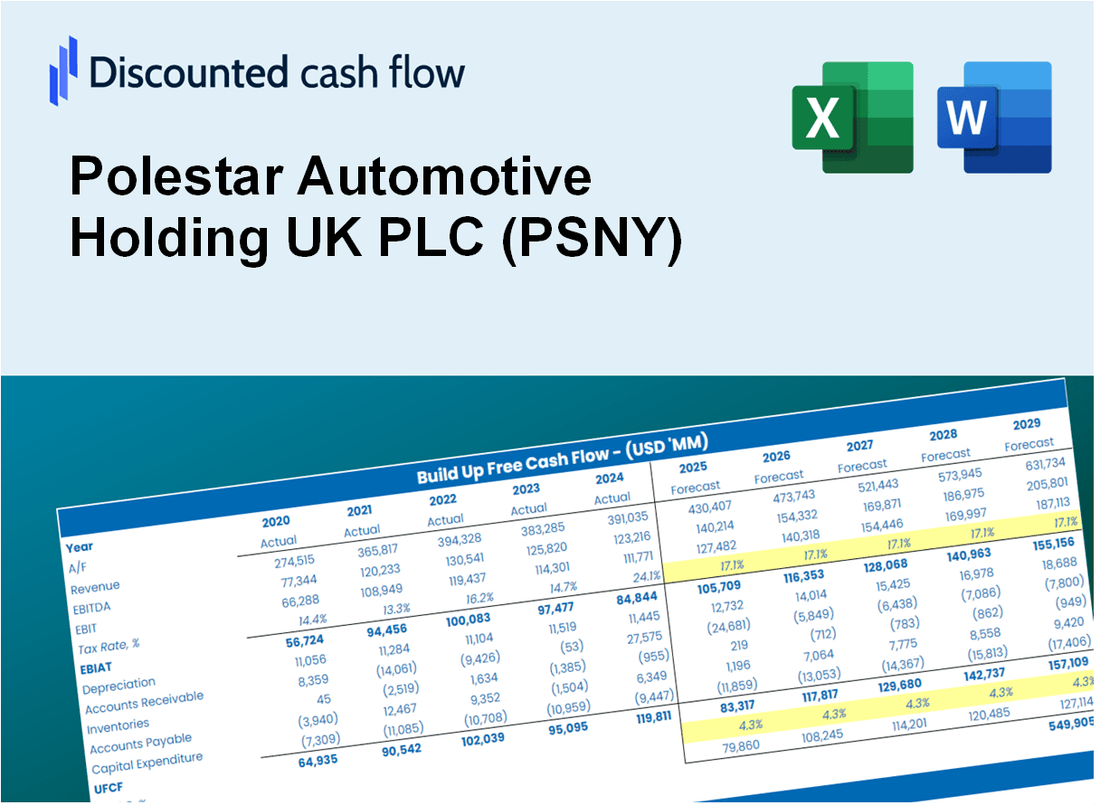
Discounted Cash Flow (DCF) - (USD MM)
| Year | AY1 2020 |
AY2 2021 |
AY3 2022 |
AY4 2023 |
AY5 2024 |
FY1 2025 |
FY2 2026 |
FY3 2027 |
FY4 2028 |
FY5 2029 |
|---|---|---|---|---|---|---|---|---|---|---|
| Revenue | 610.2 | 1,343.6 | 2,440.8 | 2,378.6 | 2,034.3 | 2,871.5 | 4,053.4 | 5,721.7 | 8,076.7 | 11,400.9 |
| Revenue Growth, % | 0 | 120.18 | 81.66 | -2.55 | -14.48 | 41.16 | 41.16 | 41.16 | 41.16 | 41.16 |
| EBITDA | -226.9 | -716.1 | -229.5 | -826.9 | -1,667.9 | -1,244.2 | -1,756.2 | -2,479.1 | -3,499.4 | -4,939.7 |
| EBITDA, % | -37.18 | -53.3 | -9.4 | -34.76 | -81.99 | -43.33 | -43.33 | -43.33 | -43.33 | -43.33 |
| Depreciation | 216.1 | 211.6 | 140.8 | 115.4 | 55.7 | 370.5 | 523.0 | 738.3 | 1,042.2 | 1,471.1 |
| Depreciation, % | 35.41 | 15.75 | 5.77 | 4.85 | 2.74 | 12.9 | 12.9 | 12.9 | 12.9 | 12.9 |
| EBIT | -443.0 | -927.7 | -370.3 | -942.3 | -1,723.7 | -1,614.7 | -2,279.2 | -3,217.3 | -4,541.5 | -6,410.8 |
| EBIT, % | -72.59 | -69.04 | -15.17 | -39.62 | -84.73 | -56.23 | -56.23 | -56.23 | -56.23 | -56.23 |
| Total Cash | 316.4 | 757.9 | 973.9 | 768.9 | 739.2 | 1,245.3 | 1,757.8 | 2,481.3 | 3,502.5 | 4,944.1 |
| Total Cash, percent | .0 | .0 | .0 | .0 | .0 | .0 | .0 | .0 | .0 | .0 |
| Account Receivables | 357.1 | 246.8 | 318.8 | 474.3 | 418.9 | 749.4 | 1,057.8 | 1,493.2 | 2,107.8 | 2,975.3 |
| Account Receivables, % | 58.52 | 18.37 | 13.06 | 19.94 | 20.59 | 26.1 | 26.1 | 26.1 | 26.1 | 26.1 |
| Inventories | 432.5 | 545.7 | 657.9 | 927.7 | 1,079.4 | 1,323.8 | 1,868.7 | 2,637.8 | 3,723.5 | 5,256.0 |
| Inventories, % | 70.88 | 40.62 | 26.95 | 39 | 53.06 | 46.1 | 46.1 | 46.1 | 46.1 | 46.1 |
| Accounts Payable | 1,145.4 | 1,542.0 | 1,032.6 | 368.1 | 893.9 | 1,732.8 | 2,446.0 | 3,452.8 | 4,873.9 | 6,879.9 |
| Accounts Payable, % | 187.7 | 114.76 | 42.3 | 15.48 | 43.94 | 60.35 | 60.35 | 60.35 | 60.35 | 60.35 |
| Capital Expenditure | -243.7 | -129.7 | -713.5 | -137.4 | -357.0 | -586.6 | -828.1 | -1,168.9 | -1,650.0 | -2,329.1 |
| Capital Expenditure, % | -39.94 | -9.65 | -29.23 | -5.78 | -17.55 | -20.43 | -20.43 | -20.43 | -20.43 | -20.43 |
| Tax Rate, % | 0.44515 | 0.44515 | 0.44515 | 0.44515 | 0.44515 | 0.44515 | 0.44515 | 0.44515 | 0.44515 | 0.44515 |
| EBITAT | -455.7 | -924.9 | -395.1 | -936.7 | -1,716.0 | -1,610.3 | -2,273.1 | -3,208.7 | -4,529.3 | -6,393.6 |
| Depreciation | ||||||||||
| Changes in Account Receivables | ||||||||||
| Changes in Inventories | ||||||||||
| Changes in Accounts Payable | ||||||||||
| Capital Expenditure | ||||||||||
| UFCF | -127.6 | -449.3 | -1,661.3 | -2,048.4 | -1,587.8 | -1,562.4 | -2,718.3 | -3,837.0 | -5,416.3 | -7,645.6 |
| WACC, % | 7.75 | 7.73 | 7.75 | 7.71 | 7.72 | 7.73 | 7.73 | 7.73 | 7.73 | 7.73 |
| PV UFCF | ||||||||||
| SUM PV UFCF | -16,150.6 | |||||||||
| Long Term Growth Rate, % | 2.00 | |||||||||
| Free cash flow (T + 1) | -7,798 | |||||||||
| Terminal Value | -136,054 | |||||||||
| Present Terminal Value | -93,754 | |||||||||
| Enterprise Value | -109,905 | |||||||||
| Net Debt | 4,273 | |||||||||
| Equity Value | -114,178 | |||||||||
| Diluted Shares Outstanding, MM | 2,110 | |||||||||
| Equity Value Per Share | -54.11 |
What You Will Receive
- Comprehensive Financial Model: Polestar's actual data facilitates accurate DCF valuation.
- Complete Forecast Control: Modify revenue growth, profit margins, WACC, and other essential metrics.
- Real-Time Calculations: Automatic updates allow you to view results instantly as adjustments are made.
- Professional-Grade Template: A polished Excel file crafted for high-quality valuation.
- Flexible and Reusable: Designed for adaptability, enabling repeated application for in-depth forecasts.
Key Features
- Pre-Loaded Data: Polestar's historical financial statements and pre-filled forecasts.
- Fully Adjustable Inputs: Modify WACC, tax rates, revenue growth, and EBITDA margins.
- Instant Results: View Polestar's intrinsic value recalculating in real time.
- Clear Visual Outputs: Dashboard charts present valuation results and key metrics.
- Built for Accuracy: A professional tool tailored for analysts, investors, and finance experts.
How It Works
- Step 1: Download the prebuilt Excel template featuring Polestar's data included.
- Step 2: Navigate through the pre-filled sheets to familiarize yourself with the essential metrics.
- Step 3: Adjust forecasts and assumptions in the editable yellow cells (WACC, growth, margins).
- Step 4: Instantly view the recalibrated results, including Polestar's intrinsic value.
- Step 5: Make well-informed investment choices or create reports using the outputs.
Why Choose This Calculator?
- Accurate Data: Real Polestar Automotive financials ensure reliable valuation results.
- Customizable: Adjust key parameters like growth rates, WACC, and tax rates to align with your forecasts.
- Time-Saving: Pre-built calculations save you the hassle of starting from the ground up.
- Professional-Grade Tool: Tailored for investors, analysts, and consultants in the automotive sector.
- User-Friendly: Intuitive design and step-by-step guidance make it accessible for everyone.
Who Should Use This Product?
- Individual Investors: Make informed decisions about buying or selling Polestar Automotive stock (PSNY).
- Financial Analysts: Streamline valuation processes with ready-to-use financial models tailored for Polestar (PSNY).
- Consultants: Deliver professional valuation insights for Polestar Automotive (PSNY) to clients quickly and accurately.
- Business Owners: Understand how companies like Polestar (PSNY) are valued to inform your own business strategy.
- Finance Students: Learn valuation techniques using real-world data and scenarios related to Polestar Automotive (PSNY).
What the Template Contains
- Pre-Filled Data: Includes Polestar's historical financials and forecasts.
- Discounted Cash Flow Model: Editable DCF valuation model with automatic calculations.
- Weighted Average Cost of Capital (WACC): A dedicated sheet for calculating WACC based on custom inputs.
- Key Financial Ratios: Analyze Polestar's profitability, efficiency, and leverage.
- Customizable Inputs: Edit revenue growth, margins, and tax rates with ease.
- Clear Dashboard: Charts and tables summarizing key valuation results.
Disclaimer
All information, articles, and product details provided on this website are for general informational and educational purposes only. We do not claim any ownership over, nor do we intend to infringe upon, any trademarks, copyrights, logos, brand names, or other intellectual property mentioned or depicted on this site. Such intellectual property remains the property of its respective owners, and any references here are made solely for identification or informational purposes, without implying any affiliation, endorsement, or partnership.
We make no representations or warranties, express or implied, regarding the accuracy, completeness, or suitability of any content or products presented. Nothing on this website should be construed as legal, tax, investment, financial, medical, or other professional advice. In addition, no part of this site—including articles or product references—constitutes a solicitation, recommendation, endorsement, advertisement, or offer to buy or sell any securities, franchises, or other financial instruments, particularly in jurisdictions where such activity would be unlawful.
All content is of a general nature and may not address the specific circumstances of any individual or entity. It is not a substitute for professional advice or services. Any actions you take based on the information provided here are strictly at your own risk. You accept full responsibility for any decisions or outcomes arising from your use of this website and agree to release us from any liability in connection with your use of, or reliance upon, the content or products found herein.