
|
Poseida Therapeutics, Inc. (PSTX) DCF -Bewertung |
Fully Editable: Tailor To Your Needs In Excel Or Sheets
Professional Design: Trusted, Industry-Standard Templates
Investor-Approved Valuation Models
MAC/PC Compatible, Fully Unlocked
No Expertise Is Needed; Easy To Follow
Poseida Therapeutics, Inc. (PSTX) Bundle
Möchten Sie den inneren Wert von Poseida Therapeutics, Inc. bewerten? Unser PSTX DCF-Taschenrechner enthält reale Daten sowie umfangreiche Anpassungsfunktionen, mit denen Sie Ihre Prognosen verfeinern und Ihre Anlagestrategien verbessern können.
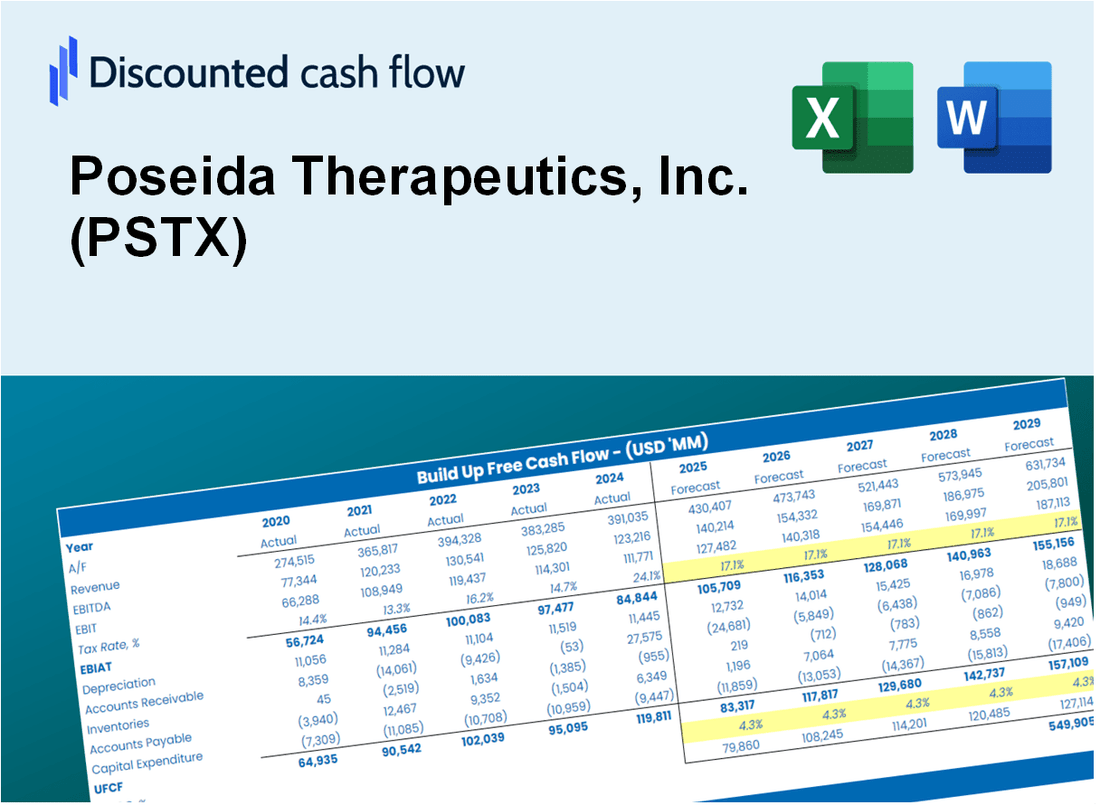
Discounted Cash Flow (DCF) - (USD MM)
| Year | AY1 2019 |
AY2 2020 |
AY3 2021 |
AY4 2022 |
AY5 2023 |
FY1 2024 |
FY2 2025 |
FY3 2026 |
FY4 2027 |
FY5 2028 |
|---|---|---|---|---|---|---|---|---|---|---|
| Revenue | .0 | .0 | .0 | 130.4 | 64.7 | 72.7 | 81.8 | 91.9 | 103.3 | 116.1 |
| Revenue Growth, % | 0 | 0 | 0 | 417217.08 | -50.37 | 12.41 | 12.41 | 12.41 | 12.41 | 12.41 |
| EBITDA | -91.7 | -145.5 | -117.1 | -54.8 | -109.0 | -6.1 | -6.9 | -7.7 | -8.7 | -9.8 |
| EBITDA, % | 100 | 100 | -374748.7 | -42.02 | -168.52 | -8.4 | -8.4 | -8.4 | -8.4 | -8.4 |
| Depreciation | 1.2 | 2.6 | 4.6 | 5.2 | 5.6 | 45.5 | 51.1 | 57.5 | 64.6 | 72.6 |
| Depreciation, % | 100 | 100 | 14572 | 3.97 | 8.68 | 62.53 | 62.53 | 62.53 | 62.53 | 62.53 |
| EBIT | -92.9 | -148.1 | -121.6 | -59.9 | -114.7 | -6.7 | -7.5 | -8.5 | -9.5 | -10.7 |
| EBIT, % | 100 | 100 | -389320.7 | -45.98 | -177.2 | -9.2 | -9.2 | -9.2 | -9.2 | -9.2 |
| Total Cash | 125.3 | 309.2 | 206.3 | 282.5 | 212.2 | 72.7 | 81.8 | 91.9 | 103.3 | 116.1 |
| Total Cash, percent | .0 | .0 | .7 | .0 | .0 | .0 | .0 | .0 | .0 | .0 |
| Account Receivables | .0 | .0 | .0 | 9.1 | 9.0 | 32.1 | 36.1 | 40.6 | 45.6 | 51.3 |
| Account Receivables, % | 100 | 100 | 0 | 6.97 | 13.93 | 44.18 | 44.18 | 44.18 | 44.18 | 44.18 |
| Inventories | .0 | .0 | .0 | 4.5 | .0 | 29.6 | 33.3 | 37.4 | 42.0 | 47.2 |
| Inventories, % | 100 | 100 | 0 | 3.42 | 0 | 40.68 | 40.68 | 40.68 | 40.68 | 40.68 |
| Accounts Payable | 4.9 | .8 | 9.0 | 2.2 | 3.3 | 44.6 | 50.2 | 56.4 | 63.4 | 71.2 |
| Accounts Payable, % | 100 | 100 | 28686.22 | 1.71 | 5.05 | 61.35 | 61.35 | 61.35 | 61.35 | 61.35 |
| Capital Expenditure | -5.2 | -16.9 | -2.6 | -3.9 | -3.1 | -15.7 | -17.6 | -19.8 | -22.3 | -25.0 |
| Capital Expenditure, % | 100 | 100 | -8432.04 | -3.01 | -4.74 | -21.55 | -21.55 | -21.55 | -21.55 | -21.55 |
| Tax Rate, % | -0.08676403 | -0.08676403 | -0.08676403 | -0.08676403 | -0.08676403 | -0.08676403 | -0.08676403 | -0.08676403 | -0.08676403 | -0.08676403 |
| EBITAT | -99.4 | 2,798.2 | 4,285.5 | -60.5 | -114.8 | -4.0 | -4.5 | -5.1 | -5.7 | -6.4 |
| Depreciation | ||||||||||
| Changes in Account Receivables | ||||||||||
| Changes in Inventories | ||||||||||
| Changes in Accounts Payable | ||||||||||
| Capital Expenditure | ||||||||||
| UFCF | -98.5 | 2,779.7 | 4,295.7 | -79.5 | -106.6 | 14.4 | 26.9 | 30.2 | 34.0 | 38.2 |
| WACC, % | 7.27 | 6.34 | 6.34 | 7.27 | 7.27 | 6.9 | 6.9 | 6.9 | 6.9 | 6.9 |
| PV UFCF | ||||||||||
| SUM PV UFCF | 115.1 | |||||||||
| Long Term Growth Rate, % | 2.00 | |||||||||
| Free cash flow (T + 1) | 39 | |||||||||
| Terminal Value | 795 | |||||||||
| Present Terminal Value | 569 | |||||||||
| Enterprise Value | 684 | |||||||||
| Net Debt | 41 | |||||||||
| Equity Value | 643 | |||||||||
| Diluted Shares Outstanding, MM | 90 | |||||||||
| Equity Value Per Share | 7.13 |
What You Will Get
- Comprehensive PSTX Financials: Access to both historical and projected data for precise valuation.
- Customizable Inputs: Adjust discount rates, tax implications, revenue forecasts, and capital investments.
- Real-Time Calculations: Intrinsic value and NPV are computed automatically.
- Scenario Analysis: Evaluate various scenarios to assess Poseida's future growth potential.
- User-Friendly Interface: Designed for industry professionals while remaining easy for newcomers.
Key Features
- Real-Life PSTX Data: Pre-filled with Poseida Therapeutics’ historical financials and forward-looking projections.
- Fully Customizable Inputs: Adjust revenue growth, margins, WACC, tax rates, and capital expenditures.
- Dynamic Valuation Model: Automatic updates to Net Present Value (NPV) and intrinsic value based on your inputs.
- Scenario Testing: Create multiple forecast scenarios to analyze different valuation outcomes.
- User-Friendly Design: Simple, structured, and designed for professionals and beginners alike.
How It Works
- Step 1: Download the Excel file for Poseida Therapeutics, Inc. (PSTX).
- Step 2: Review Poseida's pre-filled financial data and projections.
- Step 3: Adjust key inputs such as revenue growth, WACC, and tax rates (highlighted cells).
- Step 4: Observe the DCF model update in real-time as you modify assumptions.
- Step 5: Evaluate the outputs and leverage the results for investment strategies.
Why Choose Poseida Therapeutics, Inc. (PSTX)?
- Innovative Solutions: Cutting-edge therapies designed to address unmet medical needs.
- Strong Pipeline: A diverse range of product candidates targeting various cancers and genetic diseases.
- Expert Team: Led by industry veterans with extensive experience in biotechnology and pharmaceuticals.
- Commitment to Quality: Rigorous research and development processes ensure high standards of safety and efficacy.
- Collaborative Partnerships: Strategic alliances with leading organizations enhance development capabilities.
Who Should Use This Product?
- Professional Investors: Develop comprehensive and trustworthy valuation models for analyzing investments in Poseida Therapeutics, Inc. (PSTX).
- Corporate Finance Teams: Evaluate valuation scenarios to inform strategic decisions within the organization.
- Consultants and Advisors: Offer clients precise valuation insights related to Poseida Therapeutics, Inc. (PSTX).
- Students and Educators: Utilize real-world data to enhance learning and practice in financial modeling.
- Biotech Enthusiasts: Gain insights into how biotechnology companies like Poseida Therapeutics, Inc. (PSTX) are valued in the market.
What the Template Contains
- Operating and Balance Sheet Data: Pre-filled Poseida Therapeutics historical data and forecasts, including revenue, EBITDA, EBIT, and capital expenditures.
- WACC Calculation: A dedicated sheet for Weighted Average Cost of Capital (WACC), including parameters like Beta, risk-free rate, and share price.
- DCF Valuation (Unlevered and Levered): Editable Discounted Cash Flow models showing intrinsic value with detailed calculations.
- Financial Statements: Pre-loaded financial statements (annual and quarterly) to support analysis.
- Key Ratios: Includes profitability, leverage, and efficiency ratios for Poseida Therapeutics, Inc. (PSTX).
- Dashboard and Charts: Visual summary of valuation outputs and assumptions to analyze results easily.
Disclaimer
All information, articles, and product details provided on this website are for general informational and educational purposes only. We do not claim any ownership over, nor do we intend to infringe upon, any trademarks, copyrights, logos, brand names, or other intellectual property mentioned or depicted on this site. Such intellectual property remains the property of its respective owners, and any references here are made solely for identification or informational purposes, without implying any affiliation, endorsement, or partnership.
We make no representations or warranties, express or implied, regarding the accuracy, completeness, or suitability of any content or products presented. Nothing on this website should be construed as legal, tax, investment, financial, medical, or other professional advice. In addition, no part of this site—including articles or product references—constitutes a solicitation, recommendation, endorsement, advertisement, or offer to buy or sell any securities, franchises, or other financial instruments, particularly in jurisdictions where such activity would be unlawful.
All content is of a general nature and may not address the specific circumstances of any individual or entity. It is not a substitute for professional advice or services. Any actions you take based on the information provided here are strictly at your own risk. You accept full responsibility for any decisions or outcomes arising from your use of this website and agree to release us from any liability in connection with your use of, or reliance upon, the content or products found herein.