
|
PTC Therapeutics, Inc. (PTCT) DCF -Bewertung |
Fully Editable: Tailor To Your Needs In Excel Or Sheets
Professional Design: Trusted, Industry-Standard Templates
Investor-Approved Valuation Models
MAC/PC Compatible, Fully Unlocked
No Expertise Is Needed; Easy To Follow
PTC Therapeutics, Inc. (PTCT) Bundle
Sparen Sie Zeit und verbessern Sie die Präzision mit unserem DCF -Rechner von PTC Therapeutics, Inc. (PTCT)! In diesem Tool können Sie mit echten Apple -Daten und anpassbaren Annahmen PTC Therapeutics, Inc. (PTCT) wie ein erfahrener Investor prognostizieren, analysieren und bewerten.
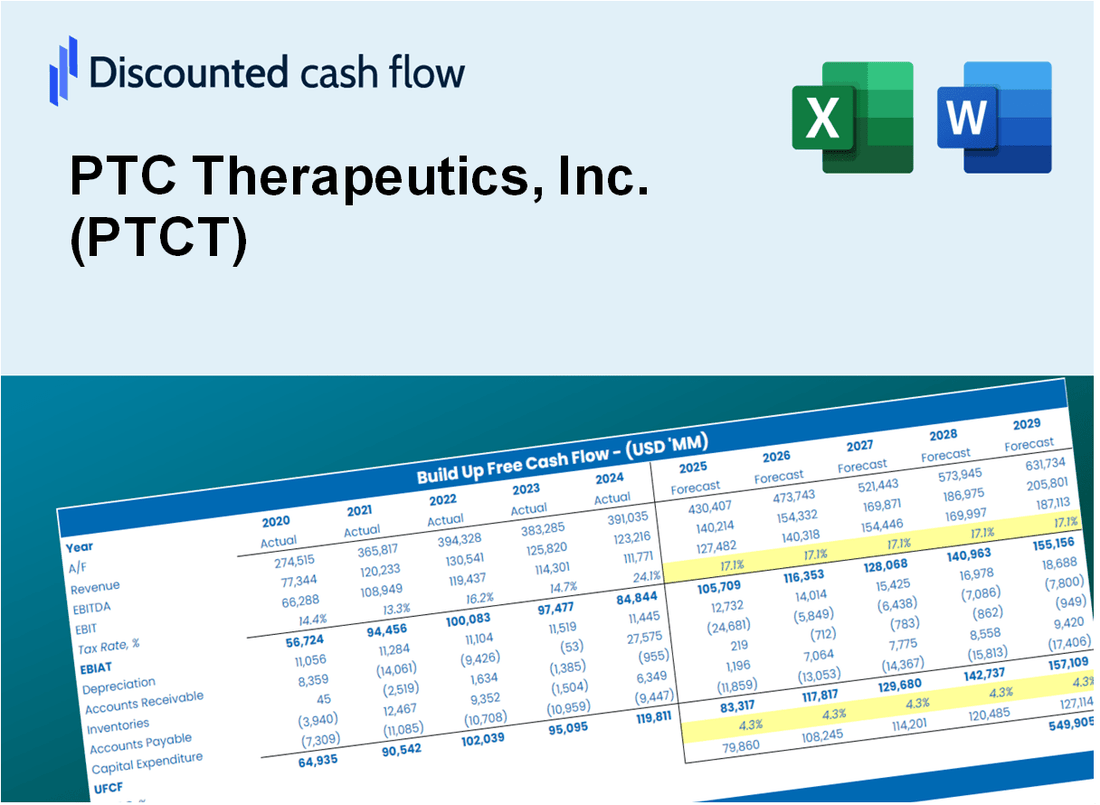
Discounted Cash Flow (DCF) - (USD MM)
| Year | AY1 2020 |
AY2 2021 |
AY3 2022 |
AY4 2023 |
AY5 2024 |
FY1 2025 |
FY2 2026 |
FY3 2027 |
FY4 2028 |
FY5 2029 |
|---|---|---|---|---|---|---|---|---|---|---|
| Revenue | 380.8 | 538.6 | 698.8 | 937.8 | 806.8 | 991.2 | 1,217.7 | 1,496.1 | 1,838.0 | 2,258.1 |
| Revenue Growth, % | 0 | 41.45 | 29.75 | 34.2 | -13.97 | 22.86 | 22.86 | 22.86 | 22.86 | 22.86 |
| EBITDA | -297.0 | -368.2 | -367.8 | -330.3 | -120.5 | -493.9 | -606.8 | -745.5 | -915.9 | -1,125.2 |
| EBITDA, % | -78 | -68.36 | -52.63 | -35.22 | -14.93 | -49.83 | -49.83 | -49.83 | -49.83 | -49.83 |
| Depreciation | 49.6 | 64.1 | 128.8 | 236.6 | 75.7 | 154.6 | 189.9 | 233.3 | 286.6 | 352.1 |
| Depreciation, % | 13.02 | 11.91 | 18.44 | 25.23 | 9.38 | 15.59 | 15.59 | 15.59 | 15.59 | 15.59 |
| EBIT | -346.6 | -432.3 | -496.6 | -566.9 | -196.1 | -648.5 | -796.7 | -978.8 | -1,202.5 | -1,477.4 |
| EBIT, % | -91.02 | -80.27 | -71.07 | -60.45 | -24.31 | -65.42 | -65.42 | -65.42 | -65.42 | -65.42 |
| Total Cash | 1,103.7 | 773.4 | 410.7 | 876.7 | 1,139.7 | 896.5 | 1,101.5 | 1,353.2 | 1,662.5 | 2,042.5 |
| Total Cash, percent | .0 | .0 | .0 | .0 | .0 | .0 | .0 | .0 | .0 | .0 |
| Account Receivables | 69.9 | 110.5 | 155.6 | 161.0 | 158.6 | 194.2 | 238.6 | 293.1 | 360.1 | 442.4 |
| Account Receivables, % | 18.37 | 20.51 | 22.27 | 17.17 | 19.65 | 19.59 | 19.59 | 19.59 | 19.59 | 19.59 |
| Inventories | 18.7 | 15.9 | 21.8 | 30.6 | 23.2 | 33.9 | 41.7 | 51.2 | 62.9 | 77.3 |
| Inventories, % | 4.91 | 2.94 | 3.12 | 3.26 | 2.87 | 3.42 | 3.42 | 3.42 | 3.42 | 3.42 |
| Accounts Payable | 18.7 | 23.0 | 27.3 | 6.0 | 17.3 | 31.5 | 38.6 | 47.5 | 58.3 | 71.7 |
| Accounts Payable, % | 4.9 | 4.28 | 3.9 | 0.64458 | 2.14 | 3.17 | 3.17 | 3.17 | 3.17 | 3.17 |
| Capital Expenditure | -56.0 | -85.3 | -152.5 | -120.6 | -6.5 | -130.9 | -160.8 | -197.6 | -242.7 | -298.2 |
| Capital Expenditure, % | -14.7 | -15.84 | -21.82 | -12.86 | -0.80592 | -13.21 | -13.21 | -13.21 | -13.21 | -13.21 |
| Tax Rate, % | -0.04846896 | -0.04846896 | -0.04846896 | -0.04846896 | -0.04846896 | -0.04846896 | -0.04846896 | -0.04846896 | -0.04846896 | -0.04846896 |
| EBITAT | -376.9 | -437.0 | -472.5 | -510.3 | -196.2 | -629.2 | -773.1 | -949.8 | -1,166.8 | -1,433.5 |
| Depreciation | ||||||||||
| Changes in Account Receivables | ||||||||||
| Changes in Inventories | ||||||||||
| Changes in Accounts Payable | ||||||||||
| Capital Expenditure | ||||||||||
| UFCF | -453.2 | -491.5 | -543.0 | -429.8 | -106.0 | -637.8 | -788.9 | -969.2 | -1,190.8 | -1,463.0 |
| WACC, % | 6.46 | 6.46 | 6.36 | 6.24 | 6.46 | 6.4 | 6.4 | 6.4 | 6.4 | 6.4 |
| PV UFCF | ||||||||||
| SUM PV UFCF | -4,103.3 | |||||||||
| Long Term Growth Rate, % | 2.00 | |||||||||
| Free cash flow (T + 1) | -1,492 | |||||||||
| Terminal Value | -33,944 | |||||||||
| Present Terminal Value | -24,896 | |||||||||
| Enterprise Value | -29,000 | |||||||||
| Net Debt | -390 | |||||||||
| Equity Value | -28,609 | |||||||||
| Diluted Shares Outstanding, MM | 77 | |||||||||
| Equity Value Per Share | -372.30 |
What You Will Get
- Real PTC Therapeutics Data: Preloaded financials – from revenue to EBIT – based on actual and projected figures for PTC Therapeutics, Inc. (PTCT).
- Full Customization: Adjust all critical parameters (yellow cells) like WACC, growth %, and tax rates specific to PTC Therapeutics, Inc. (PTCT).
- Instant Valuation Updates: Automatic recalculations to analyze the impact of changes on PTC Therapeutics, Inc. (PTCT)’s fair value.
- Versatile Excel Template: Tailored for quick edits, scenario testing, and detailed projections for PTC Therapeutics, Inc. (PTCT).
- Time-Saving and Accurate: Skip building models from scratch while maintaining precision and flexibility for PTC Therapeutics, Inc. (PTCT).
Key Features
- Customizable Drug Development Parameters: Adjust essential inputs such as clinical trial timelines, market potential, and R&D expenditures.
- Real-Time Valuation Insights: Instantly computes intrinsic value, NPV, and other financial metrics.
- High-Precision Accuracy: Utilizes PTC Therapeutics’ actual financial data for credible valuation results.
- Streamlined Scenario Analysis: Effortlessly evaluate various assumptions and analyze different outcomes.
- Efficiency Booster: Remove the complexity of constructing detailed valuation models from the ground up.
How It Works
- Download: Obtain the pre-configured Excel file containing PTC Therapeutics, Inc.'s (PTCT) financial data.
- Customize: Modify projections, such as revenue growth, EBITDA %, and WACC.
- Update Automatically: The intrinsic value and NPV calculations refresh in real-time.
- Test Scenarios: Generate various forecasts and instantly compare results.
- Make Decisions: Utilize the valuation findings to inform your investment approach.
Why Choose PTC Therapeutics, Inc. (PTCT)?
- Innovative Solutions: Cutting-edge therapies designed to address unmet medical needs.
- Proven Results: Clinical trials demonstrate significant efficacy and safety profiles.
- Patient-Centric Approach: Focused on improving the quality of life for patients and their families.
- Expert Team: Led by industry professionals with extensive experience in biotechnology.
- Commitment to Research: Continuous investment in research and development for future advancements.
Who Should Use This Product?
- Investors: Assess PTC Therapeutics' (PTCT) fair value to inform investment choices.
- CFOs: Utilize a sophisticated DCF model for accurate financial reporting and analysis.
- Consultants: Easily modify the template for client valuation reports.
- Entrepreneurs: Discover financial modeling techniques employed by leading biotech firms.
- Educators: Employ it as a resource to teach valuation methods in finance courses.
What the Template Contains
- Comprehensive DCF Model: Editable template with detailed valuation calculations tailored for PTC Therapeutics, Inc. (PTCT).
- Real-World Data: PTC Therapeutics’ historical and projected financials preloaded for thorough analysis.
- Customizable Parameters: Adjust WACC, growth rates, and tax assumptions to explore various scenarios.
- Financial Statements: Complete annual and quarterly breakdowns for enhanced insights.
- Key Ratios: Integrated analysis for profitability, efficiency, and leverage specific to PTC Therapeutics, Inc. (PTCT).
- Dashboard with Visual Outputs: Charts and tables designed for clear, actionable results related to PTC Therapeutics, Inc. (PTCT).
Disclaimer
All information, articles, and product details provided on this website are for general informational and educational purposes only. We do not claim any ownership over, nor do we intend to infringe upon, any trademarks, copyrights, logos, brand names, or other intellectual property mentioned or depicted on this site. Such intellectual property remains the property of its respective owners, and any references here are made solely for identification or informational purposes, without implying any affiliation, endorsement, or partnership.
We make no representations or warranties, express or implied, regarding the accuracy, completeness, or suitability of any content or products presented. Nothing on this website should be construed as legal, tax, investment, financial, medical, or other professional advice. In addition, no part of this site—including articles or product references—constitutes a solicitation, recommendation, endorsement, advertisement, or offer to buy or sell any securities, franchises, or other financial instruments, particularly in jurisdictions where such activity would be unlawful.
All content is of a general nature and may not address the specific circumstances of any individual or entity. It is not a substitute for professional advice or services. Any actions you take based on the information provided here are strictly at your own risk. You accept full responsibility for any decisions or outcomes arising from your use of this website and agree to release us from any liability in connection with your use of, or reliance upon, the content or products found herein.