
|
Polypid Ltd. (PYPD) DCF -Bewertung |
Fully Editable: Tailor To Your Needs In Excel Or Sheets
Professional Design: Trusted, Industry-Standard Templates
Investor-Approved Valuation Models
MAC/PC Compatible, Fully Unlocked
No Expertise Is Needed; Easy To Follow
PolyPid Ltd. (PYPD) Bundle
Entdecken Sie die finanziellen Aussichten von Polypid Ltd. (PYPD) mit unserem benutzerfreundlichen DCF-Taschenrechner! Geben Sie Ihre Annahmen in Bezug auf Wachstum, Margen und Kosten ein, um den inneren Wert von Polypid Ltd. (PYPD) zu berechnen und Ihre Anlagestrategie zu verbessern.
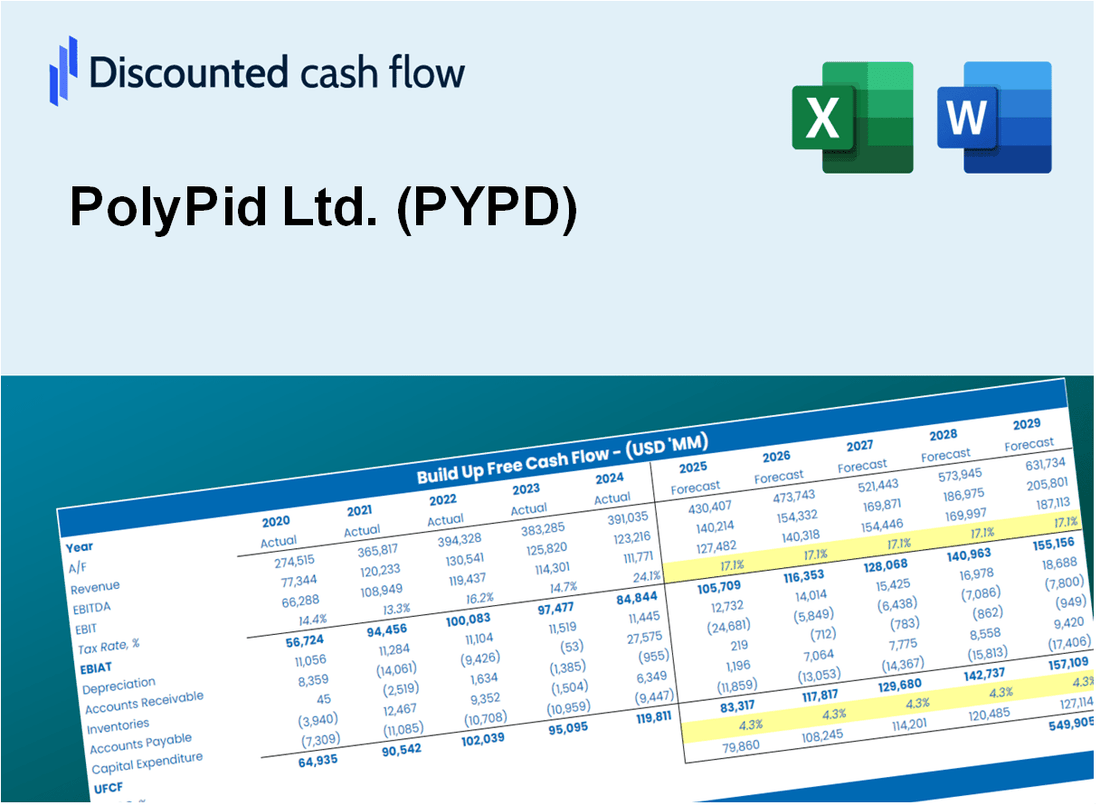
Discounted Cash Flow (DCF) - (USD MM)
| Year | AY1 2020 |
AY2 2021 |
AY3 2022 |
AY4 2023 |
AY5 2024 |
FY1 2025 |
FY2 2026 |
FY3 2027 |
FY4 2028 |
FY5 2029 |
|---|---|---|---|---|---|---|---|---|---|---|
| Revenue | .0 | .0 | .0 | .0 | .0 | .0 | .0 | .0 | .0 | .0 |
| Revenue Growth, % | 0 | 0 | 0 | 0 | 0 | 0 | 0 | 0 | 0 | 0 |
| EBITDA | -35.9 | -41.5 | -36.4 | -21.0 | -26.4 | .0 | .0 | .0 | .0 | .0 |
| EBITDA, % | 100 | 100 | 100 | 100 | 100 | 100 | 100 | 100 | 100 | 100 |
| Depreciation | 1.0 | 1.1 | 1.7 | 1.8 | 1.6 | .0 | .0 | .0 | .0 | .0 |
| Depreciation, % | 100 | 100 | 100 | 100 | 100 | 100 | 100 | 100 | 100 | 100 |
| EBIT | -36.9 | -42.6 | -38.1 | -22.9 | -28.0 | .0 | .0 | .0 | .0 | .0 |
| EBIT, % | 100 | 100 | 100 | 100 | 100 | 100 | 100 | 100 | 100 | 100 |
| Total Cash | 44.5 | 32.2 | 12.6 | 5.6 | 15.6 | .0 | .0 | .0 | .0 | .0 |
| Total Cash, percent | .0 | .0 | .0 | .0 | .0 | .0 | .0 | .0 | .0 | .0 |
| Account Receivables | .1 | .1 | .3 | .0 | .0 | .0 | .0 | .0 | .0 | .0 |
| Account Receivables, % | 100 | 100 | 100 | 100 | 100 | 100 | 100 | 100 | 100 | 100 |
| Inventories | .0 | .0 | .0 | .0 | .0 | .0 | .0 | .0 | .0 | .0 |
| Inventories, % | 100 | 100 | 100 | 100 | 100 | 100 | 100 | 100 | 100 | 100 |
| Accounts Payable | 1.0 | 4.1 | 1.1 | .8 | 2.4 | .0 | .0 | .0 | .0 | .0 |
| Accounts Payable, % | 100 | 100 | 100 | 100 | 100 | 100 | 100 | 100 | 100 | 100 |
| Capital Expenditure | -1.2 | -3.0 | -1.8 | -.2 | -.1 | .0 | .0 | .0 | .0 | .0 |
| Capital Expenditure, % | 100 | 100 | 100 | 100 | 100 | 0 | 0 | 0 | 0 | 0 |
| Tax Rate, % | -0.14493 | -0.14493 | -0.14493 | -0.14493 | -0.14493 | -0.14493 | -0.14493 | -0.14493 | -0.14493 | -0.14493 |
| EBITAT | -35.3 | -40.7 | -38.2 | -22.9 | -28.1 | .0 | .0 | .0 | .0 | .0 |
| Depreciation | ||||||||||
| Changes in Account Receivables | ||||||||||
| Changes in Inventories | ||||||||||
| Changes in Accounts Payable | ||||||||||
| Capital Expenditure | ||||||||||
| UFCF | -34.7 | -39.4 | -41.4 | -21.4 | -24.9 | -2.4 | .0 | .0 | .0 | .0 |
| WACC, % | 12.19 | 12.18 | 12.4 | 12.4 | 12.4 | 12.31 | 12.31 | 12.31 | 12.31 | 12.31 |
| PV UFCF | ||||||||||
| SUM PV UFCF | -2.1 | |||||||||
| Long Term Growth Rate, % | 2.00 | |||||||||
| Free cash flow (T + 1) | 0 | |||||||||
| Terminal Value | 0 | |||||||||
| Present Terminal Value | 0 | |||||||||
| Enterprise Value | -2 | |||||||||
| Net Debt | -6 | |||||||||
| Equity Value | 4 | |||||||||
| Diluted Shares Outstanding, MM | 6 | |||||||||
| Equity Value Per Share | 0.66 |
What You Will Get
- Comprehensive PYPD Financials: Access to both historical and projected data for precise valuation.
- Customizable Inputs: Adjust parameters like WACC, tax rates, revenue growth, and capital expenditures.
- Dynamic Calculations: Intrinsic value and NPV are computed in real-time.
- Scenario Analysis: Evaluate various scenarios to assess PolyPid's future performance.
- User-Friendly Interface: Designed for experts but easy for newcomers to navigate.
Key Features
- Comprehensive DCF Calculator: Offers detailed unlevered and levered DCF valuation models tailored for PolyPid Ltd. (PYPD).
- WACC Calculator: Pre-designed Weighted Average Cost of Capital sheet with adjustable inputs specific to PYPD.
- Customizable Forecast Assumptions: Adjust growth rates, capital expenditures, and discount rates to fit PolyPid's projections.
- Integrated Financial Ratios: Evaluate profitability, leverage, and efficiency ratios relevant to PolyPid Ltd. (PYPD).
- Visual Dashboard and Charts: Graphical representations summarize essential valuation metrics for straightforward analysis.
How It Works
- 1. Access the Model: Download and open the Excel file containing PolyPid Ltd.'s (PYPD) financial data.
- 2. Adjust Variables: Modify essential inputs such as revenue growth, discount rates, and operating expenses.
- 3. Analyze Results Immediately: The DCF model automatically computes the intrinsic value and net present value (NPV).
- 4. Explore Scenarios: Evaluate various projections to understand different valuation possibilities.
- 5. Present with Assurance: Deliver expert valuation insights to enhance your strategic decisions.
Why Choose This Calculator for PolyPid Ltd. (PYPD)?
- Designed for Experts: A sophisticated tool utilized by industry analysts, financial officers, and strategic consultants.
- Accurate Financial Insights: PolyPid’s historical and projected financial data preloaded for precise analysis.
- Flexible Scenario Analysis: Effortlessly model various forecasts and assumptions to explore outcomes.
- Comprehensive Outputs: Automatically computes intrinsic value, NPV, and essential financial metrics.
- User-Friendly Interface: Step-by-step guidance ensures a smooth calculation experience.
Who Should Use This Product?
- Healthcare Investors: Develop comprehensive valuation models for assessing PolyPid Ltd. (PYPD) investment opportunities.
- Biotech Corporate Teams: Evaluate valuation scenarios to inform strategic decisions within the company.
- Consultants and Advisors: Offer clients precise valuation analyses for PolyPid Ltd. (PYPD) stock.
- Students and Educators: Utilize real-time data to learn and teach financial modeling in the biotech sector.
- Pharmaceutical Enthusiasts: Gain insights into how biotech firms like PolyPid Ltd. (PYPD) are valued in the market.
What the Template Contains
- Pre-Filled Data: Contains PolyPid Ltd.'s historical financials and projections.
- Discounted Cash Flow Model: Editable DCF valuation model featuring automatic calculations.
- Weighted Average Cost of Capital (WACC): A dedicated sheet for calculating WACC with user-defined inputs.
- Key Financial Ratios: Assess PolyPid Ltd.'s profitability, efficiency, and leverage metrics.
- Customizable Inputs: Easily modify revenue growth, profit margins, and tax rates.
- Clear Dashboard: Visuals and tables that summarize essential valuation outcomes.
Disclaimer
All information, articles, and product details provided on this website are for general informational and educational purposes only. We do not claim any ownership over, nor do we intend to infringe upon, any trademarks, copyrights, logos, brand names, or other intellectual property mentioned or depicted on this site. Such intellectual property remains the property of its respective owners, and any references here are made solely for identification or informational purposes, without implying any affiliation, endorsement, or partnership.
We make no representations or warranties, express or implied, regarding the accuracy, completeness, or suitability of any content or products presented. Nothing on this website should be construed as legal, tax, investment, financial, medical, or other professional advice. In addition, no part of this site—including articles or product references—constitutes a solicitation, recommendation, endorsement, advertisement, or offer to buy or sell any securities, franchises, or other financial instruments, particularly in jurisdictions where such activity would be unlawful.
All content is of a general nature and may not address the specific circumstances of any individual or entity. It is not a substitute for professional advice or services. Any actions you take based on the information provided here are strictly at your own risk. You accept full responsibility for any decisions or outcomes arising from your use of this website and agree to release us from any liability in connection with your use of, or reliance upon, the content or products found herein.