
|
Pyxis Oncology, Inc. (PYXS) DCF -Bewertung |
Fully Editable: Tailor To Your Needs In Excel Or Sheets
Professional Design: Trusted, Industry-Standard Templates
Investor-Approved Valuation Models
MAC/PC Compatible, Fully Unlocked
No Expertise Is Needed; Easy To Follow
Pyxis Oncology, Inc. (PYXS) Bundle
Verbessern Sie Ihre Anlagestrategien mit dem [Symbol] DCF -Taschenrechner! Verwenden Sie echte Finanzdaten für Pyxis -Onkologie, passen Sie Wachstumsprojektionen und -kosten an und beobachten Sie sofort, wie sich diese Anpassungen auf den intrinsischen Wert [Symbol] auswirken.
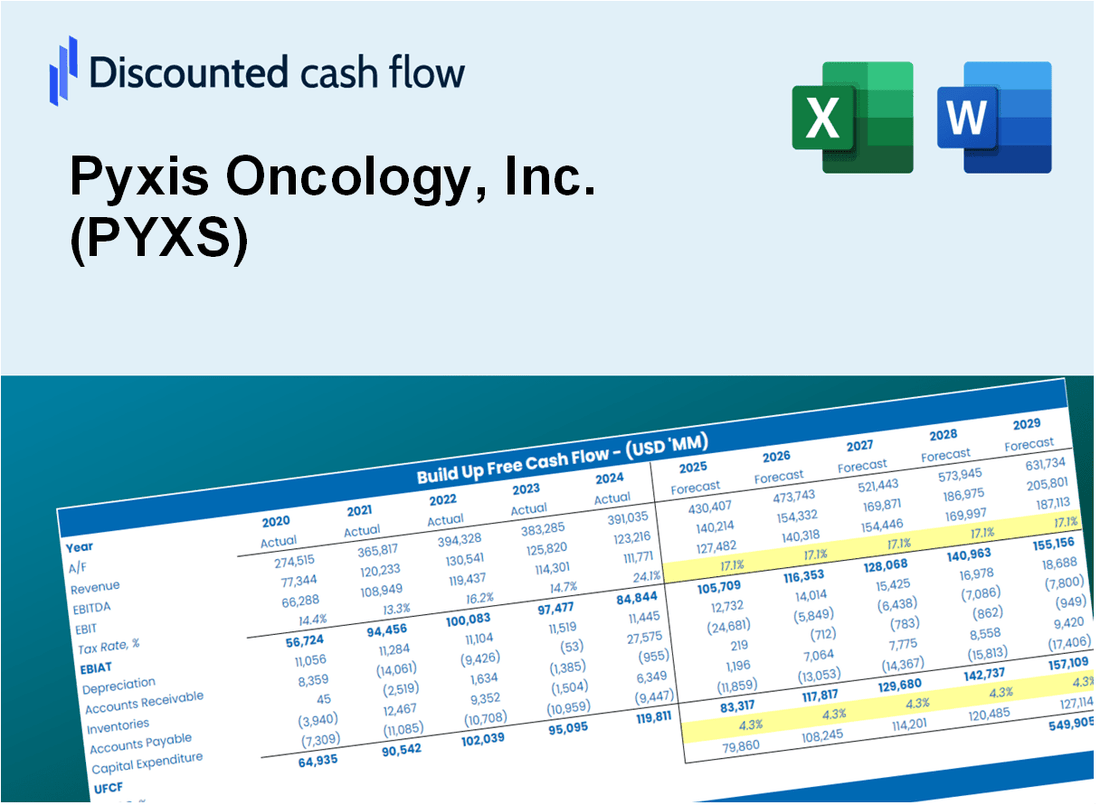
Discounted Cash Flow (DCF) - (USD MM)
| Year | AY1 2020 |
AY2 2021 |
AY3 2022 |
AY4 2023 |
AY5 2024 |
FY1 2025 |
FY2 2026 |
FY3 2027 |
FY4 2028 |
FY5 2029 |
|---|---|---|---|---|---|---|---|---|---|---|
| Revenue | .0 | .0 | .0 | .0 | 16.1 | 16.1 | 16.1 | 16.1 | 16.1 | 16.1 |
| Revenue Growth, % | 0 | 0 | 0 | 0 | 0 | 0 | 0 | 0 | 0 | 0 |
| EBITDA | -12.4 | -69.1 | -122.8 | -80.3 | -65.5 | 9.7 | 9.7 | 9.7 | 9.7 | 9.7 |
| EBITDA, % | 100 | 100 | 100 | 100 | -405.76 | 60 | 60 | 60 | 60 | 60 |
| Depreciation | .5 | .6 | .7 | 1.9 | 3.0 | 13.5 | 13.5 | 13.5 | 13.5 | 13.5 |
| Depreciation, % | 100 | 100 | 100 | 100 | 18.47 | 83.69 | 83.69 | 83.69 | 83.69 | 83.69 |
| EBIT | -12.9 | -69.7 | -123.5 | -82.2 | -68.5 | 9.7 | 9.7 | 9.7 | 9.7 | 9.7 |
| EBIT, % | 100 | 100 | 100 | 100 | -424.23 | 60 | 60 | 60 | 60 | 60 |
| Total Cash | 8.1 | 274.7 | 179.3 | 119.3 | 126.9 | 16.1 | 16.1 | 16.1 | 16.1 | 16.1 |
| Total Cash, percent | .0 | .0 | .0 | .0 | .0 | .0 | .0 | .0 | .0 | .0 |
| Account Receivables | .0 | .0 | .6 | .0 | .0 | 12.9 | 12.9 | 12.9 | 12.9 | 12.9 |
| Account Receivables, % | 100 | 100 | 100 | 100 | 0 | 80 | 80 | 80 | 80 | 80 |
| Inventories | .0 | .0 | .0 | .0 | .0 | 12.9 | 12.9 | 12.9 | 12.9 | 12.9 |
| Inventories, % | 100 | 100 | 100 | 100 | 0 | 80 | 80 | 80 | 80 | 80 |
| Accounts Payable | 1.1 | 12.0 | 7.1 | 3.9 | 4.9 | 13.9 | 13.9 | 13.9 | 13.9 | 13.9 |
| Accounts Payable, % | 100 | 100 | 100 | 100 | 30.09 | 86.02 | 86.02 | 86.02 | 86.02 | 86.02 |
| Capital Expenditure | -1.5 | -.5 | -6.4 | -6.7 | -.2 | .0 | .0 | .0 | .0 | .0 |
| Capital Expenditure, % | 100 | 100 | 100 | 100 | -1.47 | -0.29357 | -0.29357 | -0.29357 | -0.29357 | -0.29357 |
| Tax Rate, % | 2.72 | 2.72 | 2.72 | 2.72 | 2.72 | 2.72 | 2.72 | 2.72 | 2.72 | 2.72 |
| EBITAT | -12.9 | -69.7 | -123.5 | -82.2 | -66.6 | 9.6 | 9.6 | 9.6 | 9.6 | 9.6 |
| Depreciation | ||||||||||
| Changes in Account Receivables | ||||||||||
| Changes in Inventories | ||||||||||
| Changes in Accounts Payable | ||||||||||
| Capital Expenditure | ||||||||||
| UFCF | -12.8 | -58.7 | -134.6 | -89.6 | -62.9 | 6.3 | 23.1 | 23.1 | 23.1 | 23.1 |
| WACC, % | 9.92 | 9.92 | 9.92 | 9.92 | 9.91 | 9.91 | 9.91 | 9.91 | 9.91 | 9.91 |
| PV UFCF | ||||||||||
| SUM PV UFCF | 72.5 | |||||||||
| Long Term Growth Rate, % | 2.00 | |||||||||
| Free cash flow (T + 1) | 24 | |||||||||
| Terminal Value | 298 | |||||||||
| Present Terminal Value | 186 | |||||||||
| Enterprise Value | 258 | |||||||||
| Net Debt | 1 | |||||||||
| Equity Value | 257 | |||||||||
| Diluted Shares Outstanding, MM | 58 | |||||||||
| Equity Value Per Share | 4.40 |
What You Will Get
- Editable Excel Template: A fully customizable Excel-based DCF Calculator featuring pre-filled real PYXS financials.
- Real-World Data: Historical data and forward-looking estimates (as indicated in the yellow cells).
- Forecast Flexibility: Adjust forecast assumptions such as revenue growth, EBITDA %, and WACC.
- Automatic Calculations: Instantly observe the effect of your inputs on Pyxis Oncology’s valuation.
- Professional Tool: Designed for investors, CFOs, consultants, and financial analysts.
- User-Friendly Design: Organized for clarity and ease of use, complete with step-by-step instructions.
Key Features
- 🔍 Real-Life PYXS Financials: Pre-filled historical and projected data for Pyxis Oncology, Inc.
- ✏️ Fully Customizable Inputs: Adjust all critical parameters (yellow cells) like WACC, growth %, and tax rates.
- 📊 Professional DCF Valuation: Built-in formulas calculate Pyxis Oncology’s intrinsic value using the Discounted Cash Flow method.
- ⚡ Instant Results: Visualize Pyxis Oncology’s valuation instantly after making changes.
- Scenario Analysis: Test and compare outcomes for various financial assumptions side-by-side.
How It Works
- Download: Get the pre-prepared Excel file featuring Pyxis Oncology, Inc.'s (PYXS) financial metrics.
- Customize: Modify projections such as revenue growth, EBITDA %, and WACC according to your analysis.
- Update Automatically: The intrinsic value and NPV calculations refresh in real-time as you make changes.
- Test Scenarios: Develop various forecasts and evaluate different outcomes instantly.
- Make Decisions: Utilize the valuation insights to inform your investment approach.
Why Choose This Calculator for Pyxis Oncology, Inc. (PYXS)?
- Accurate Data: Up-to-date Pyxis Oncology financials provide dependable valuation outcomes.
- Customizable: Modify essential parameters such as growth rates, WACC, and tax rates to fit your forecasts.
- Time-Saving: Ready-to-use calculations save you from starting from the ground up.
- Professional-Grade Tool: Tailored for investors, analysts, and consultants in the biotech sector.
- User-Friendly: Clear layout and guided instructions ensure accessibility for all users.
Who Should Use This Product?
- Investors: Accurately assess Pyxis Oncology's fair value before making investment decisions.
- CFOs: Utilize a professional-grade DCF model for financial reporting and analysis related to Pyxis Oncology.
- Consultants: Easily customize the template for valuation reports focused on Pyxis Oncology for clients.
- Entrepreneurs: Acquire knowledge about financial modeling practices utilized by leading biotech firms.
- Educators: Employ it as a teaching resource to illustrate valuation methodologies in the biotech sector.
What the Template Contains
- Pre-Filled Data: Includes Pyxis Oncology's historical financials and projections.
- Discounted Cash Flow Model: Editable DCF valuation model with automatic calculations.
- Weighted Average Cost of Capital (WACC): A dedicated sheet for calculating WACC based on custom inputs.
- Key Financial Ratios: Analyze Pyxis Oncology's profitability, efficiency, and leverage.
- Customizable Inputs: Edit revenue growth, margins, and tax rates with ease.
- Clear Dashboard: Charts and tables summarizing key valuation results.
Disclaimer
All information, articles, and product details provided on this website are for general informational and educational purposes only. We do not claim any ownership over, nor do we intend to infringe upon, any trademarks, copyrights, logos, brand names, or other intellectual property mentioned or depicted on this site. Such intellectual property remains the property of its respective owners, and any references here are made solely for identification or informational purposes, without implying any affiliation, endorsement, or partnership.
We make no representations or warranties, express or implied, regarding the accuracy, completeness, or suitability of any content or products presented. Nothing on this website should be construed as legal, tax, investment, financial, medical, or other professional advice. In addition, no part of this site—including articles or product references—constitutes a solicitation, recommendation, endorsement, advertisement, or offer to buy or sell any securities, franchises, or other financial instruments, particularly in jurisdictions where such activity would be unlawful.
All content is of a general nature and may not address the specific circumstances of any individual or entity. It is not a substitute for professional advice or services. Any actions you take based on the information provided here are strictly at your own risk. You accept full responsibility for any decisions or outcomes arising from your use of this website and agree to release us from any liability in connection with your use of, or reliance upon, the content or products found herein.