
|
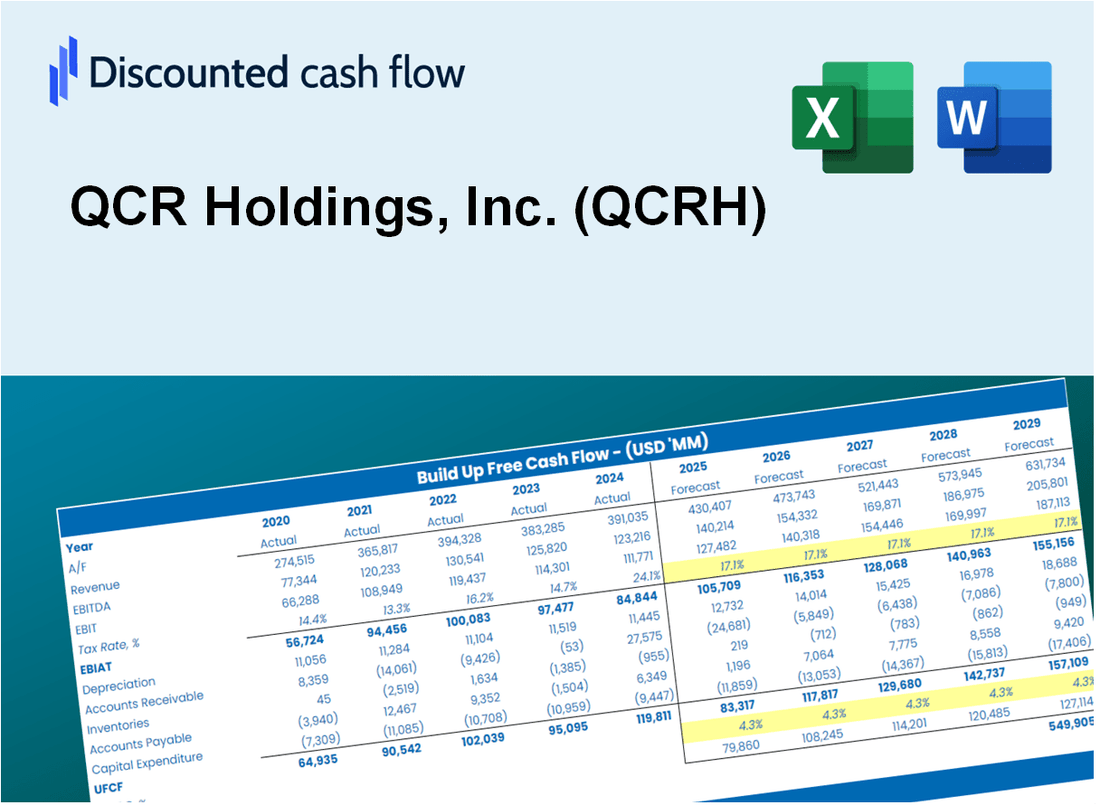
QCR Holdings, Inc. (QCRH) DCF -Bewertung |
Fully Editable: Tailor To Your Needs In Excel Or Sheets
Professional Design: Trusted, Industry-Standard Templates
Investor-Approved Valuation Models
MAC/PC Compatible, Fully Unlocked
No Expertise Is Needed; Easy To Follow
QCR Holdings, Inc. (QCRH) Bundle
Unser (QCRH) DCF-Taschenrechner entwickelt für die Genauigkeit und ermöglicht es Ihnen, die Bewertung von QCR Holdings, Inc. unter Verwendung realer Finanzdaten zu bewerten und vollständige Flexibilität zu bieten, um alle wesentlichen Parameter für verbesserte Projektionen zu ändern.
Discounted Cash Flow (DCF) - (USD MM)
| Year | AY1 2020 |
AY2 2021 |
AY3 2022 |
AY4 2023 |
AY5 2024 |
FY1 2025 |
FY2 2026 |
FY3 2027 |
FY4 2028 |
FY5 2029 |
|---|---|---|---|---|---|---|---|---|---|---|
| Revenue | 306.6 | 293.8 | 365.6 | 535.6 | 587.8 | 700.2 | 834.1 | 993.7 | 1,183.8 | 1,410.2 |
| Revenue Growth, % | 0 | -4.18 | 24.46 | 46.5 | 9.74 | 19.13 | 19.13 | 19.13 | 19.13 | 19.13 |
| EBITDA | 80.8 | 128.9 | 124.1 | 138.3 | 133.8 | 213.9 | 254.8 | 303.5 | 361.6 | 430.8 |
| EBITDA, % | 26.35 | 43.86 | 33.93 | 25.82 | 22.77 | 30.55 | 30.55 | 30.55 | 30.55 | 30.55 |
| Depreciation | 7.5 | 7.4 | 10.5 | 11.7 | 11.2 | 16.7 | 19.9 | 23.7 | 28.2 | 33.6 |
| Depreciation, % | 2.44 | 2.52 | 2.88 | 2.18 | 1.91 | 2.38 | 2.38 | 2.38 | 2.38 | 2.38 |
| EBIT | 73.3 | 121.5 | 113.5 | 126.6 | 122.6 | 197.2 | 234.9 | 279.8 | 333.4 | 397.1 |
| EBIT, % | 23.9 | 41.35 | 31.06 | 23.64 | 20.85 | 28.16 | 28.16 | 28.16 | 28.16 | 28.16 |
| Total Cash | 509.9 | 450.6 | 468.0 | 501.7 | 516.3 | 674.3 | 803.3 | 956.9 | 1,140.0 | 1,358.0 |
| Total Cash, percent | .0 | .0 | .0 | .0 | .0 | .0 | .0 | .0 | .0 | .0 |
| Account Receivables | 64.3 | 43.6 | 30.9 | 30.2 | 16.5 | 73.8 | 87.9 | 104.8 | 124.8 | 148.7 |
| Account Receivables, % | 20.96 | 14.86 | 8.46 | 5.63 | 2.81 | 10.54 | 10.54 | 10.54 | 10.54 | 10.54 |
| Inventories | .0 | .0 | .0 | .0 | .0 | .0 | .0 | .0 | .0 | .0 |
| Inventories, % | 0 | 0 | 0 | 0 | 0 | 0 | 0 | 0 | 0 | 0 |
| Accounts Payable | .0 | .0 | .0 | .0 | .0 | .0 | .0 | .0 | .0 | .0 |
| Accounts Payable, % | 0 | 0 | 0 | 0 | 0 | 0 | 0 | 0 | 0 | 0 |
| Capital Expenditure | -4.3 | -14.0 | -33.3 | -14.9 | -44.5 | -35.9 | -42.7 | -50.9 | -60.6 | -72.2 |
| Capital Expenditure, % | -1.39 | -4.76 | -9.1 | -2.79 | -7.57 | -5.12 | -5.12 | -5.12 | -5.12 | -5.12 |
| Tax Rate, % | 7.12 | 7.12 | 7.12 | 7.12 | 7.12 | 7.12 | 7.12 | 7.12 | 7.12 | 7.12 |
| EBITAT | 60.6 | 98.9 | 99.1 | 113.6 | 113.9 | 171.1 | 203.8 | 242.8 | 289.3 | 344.6 |
| Depreciation | ||||||||||
| Changes in Account Receivables | ||||||||||
| Changes in Inventories | ||||||||||
| Changes in Accounts Payable | ||||||||||
| Capital Expenditure | ||||||||||
| UFCF | -.5 | 112.9 | 89.0 | 111.0 | 94.3 | 94.6 | 166.9 | 198.8 | 236.8 | 282.2 |
| WACC, % | 16.36 | 16.2 | 16.96 | 17.29 | 17.71 | 16.9 | 16.9 | 16.9 | 16.9 | 16.9 |
| PV UFCF | ||||||||||
| SUM PV UFCF | 583.6 | |||||||||
| Long Term Growth Rate, % | 2.00 | |||||||||
| Free cash flow (T + 1) | 288 | |||||||||
| Terminal Value | 1,931 | |||||||||
| Present Terminal Value | 884 | |||||||||
| Enterprise Value | 1,468 | |||||||||
| Net Debt | 333 | |||||||||
| Equity Value | 1,135 | |||||||||
| Diluted Shares Outstanding, MM | 17 | |||||||||
| Equity Value Per Share | 66.95 |
What You Will Get
- Editable Forecast Inputs: Easily adjust key assumptions (growth %, margins, WACC) to explore various scenarios.
- Real-World Data: QCR Holdings, Inc. (QCRH) financial data pre-loaded to facilitate your analysis.
- Automatic DCF Outputs: The template computes Net Present Value (NPV) and intrinsic value automatically.
- Customizable and Professional: A refined Excel model that caters to your valuation requirements.
- Built for Analysts and Investors: Perfect for evaluating projections, confirming strategies, and enhancing efficiency.
Key Features
- Comprehensive DCF Calculator: Features detailed unlevered and levered DCF valuation models tailored for QCR Holdings, Inc. (QCRH).
- WACC Calculator: Pre-configured Weighted Average Cost of Capital sheet with adjustable inputs specific to QCRH.
- Customizable Forecast Assumptions: Easily alter growth rates, capital expenditures, and discount rates relevant to QCR Holdings.
- Integrated Financial Ratios: Evaluate profitability, leverage, and efficiency ratios for QCR Holdings, Inc. (QCRH).
- Interactive Dashboard and Charts: Visual representations summarize essential valuation metrics for straightforward analysis.
How It Functions
- Download the Template: Gain immediate access to the Excel-based QCRH DCF Calculator.
- Input Your Assumptions: Modify the yellow-highlighted cells for growth rates, WACC, margins, and additional parameters.
- Instant Calculations: The model automatically refreshes QCR Holdings, Inc.’s intrinsic value.
- Test Scenarios: Experiment with various assumptions to assess potential valuation shifts.
- Analyze and Decide: Utilize the results to inform your investment or financial analysis.
Why Choose This Calculator for QCR Holdings, Inc. (QCRH)?
- Accuracy: Up-to-date QCRH financials guarantee precise data.
- Flexibility: Users can easily test and adjust inputs as needed.
- Time-Saving: Avoid the complexities of creating a DCF model from the ground up.
- Professional-Grade: Crafted with the expertise and attention to detail expected at the CFO level.
- User-Friendly: Intuitive interface suitable for users with varying levels of financial modeling experience.
Who Should Use This Product?
- Investors: Assess QCR Holdings, Inc. (QCRH) valuation to make informed stock trading decisions.
- CFOs and Financial Analysts: Enhance valuation methodologies and evaluate financial forecasts for QCRH.
- Startup Founders: Gain insights into how companies like QCR Holdings, Inc. (QCRH) are appraised in the market.
- Consultants: Provide detailed valuation analyses and reports for clients interested in QCRH.
- Students and Educators: Utilize QCRH data to teach and practice valuation strategies effectively.
What the Template Contains
- Pre-Filled Data: Includes QCR Holdings, Inc. (QCRH) historical financials and forecasts.
- Discounted Cash Flow Model: Editable DCF valuation model with automatic calculations.
- Weighted Average Cost of Capital (WACC): A dedicated sheet for calculating WACC based on custom inputs.
- Key Financial Ratios: Analyze QCR Holdings, Inc. (QCRH) profitability, efficiency, and leverage.
- Customizable Inputs: Edit revenue growth, margins, and tax rates with ease.
- Clear Dashboard: Charts and tables summarizing key valuation results.
Disclaimer
All information, articles, and product details provided on this website are for general informational and educational purposes only. We do not claim any ownership over, nor do we intend to infringe upon, any trademarks, copyrights, logos, brand names, or other intellectual property mentioned or depicted on this site. Such intellectual property remains the property of its respective owners, and any references here are made solely for identification or informational purposes, without implying any affiliation, endorsement, or partnership.
We make no representations or warranties, express or implied, regarding the accuracy, completeness, or suitability of any content or products presented. Nothing on this website should be construed as legal, tax, investment, financial, medical, or other professional advice. In addition, no part of this site—including articles or product references—constitutes a solicitation, recommendation, endorsement, advertisement, or offer to buy or sell any securities, franchises, or other financial instruments, particularly in jurisdictions where such activity would be unlawful.
All content is of a general nature and may not address the specific circumstances of any individual or entity. It is not a substitute for professional advice or services. Any actions you take based on the information provided here are strictly at your own risk. You accept full responsibility for any decisions or outcomes arising from your use of this website and agree to release us from any liability in connection with your use of, or reliance upon, the content or products found herein.