
|
Qudian Inc. (QD) DCF -Bewertung |
Fully Editable: Tailor To Your Needs In Excel Or Sheets
Professional Design: Trusted, Industry-Standard Templates
Investor-Approved Valuation Models
MAC/PC Compatible, Fully Unlocked
No Expertise Is Needed; Easy To Follow
Qudian Inc. (QD) Bundle
Bewerten Sie den finanziellen Ausblick von Qudian Inc. (QD) wie ein Experte! Dieser (QD) DCF-Taschenrechner bietet Ihnen vorgefüllte Finanzdaten und die Flexibilität, das Umsatzwachstum, WACC, Margen und andere kritische Annahmen zu ändern, um sich mit Ihren Vorhersagen auszurichten.
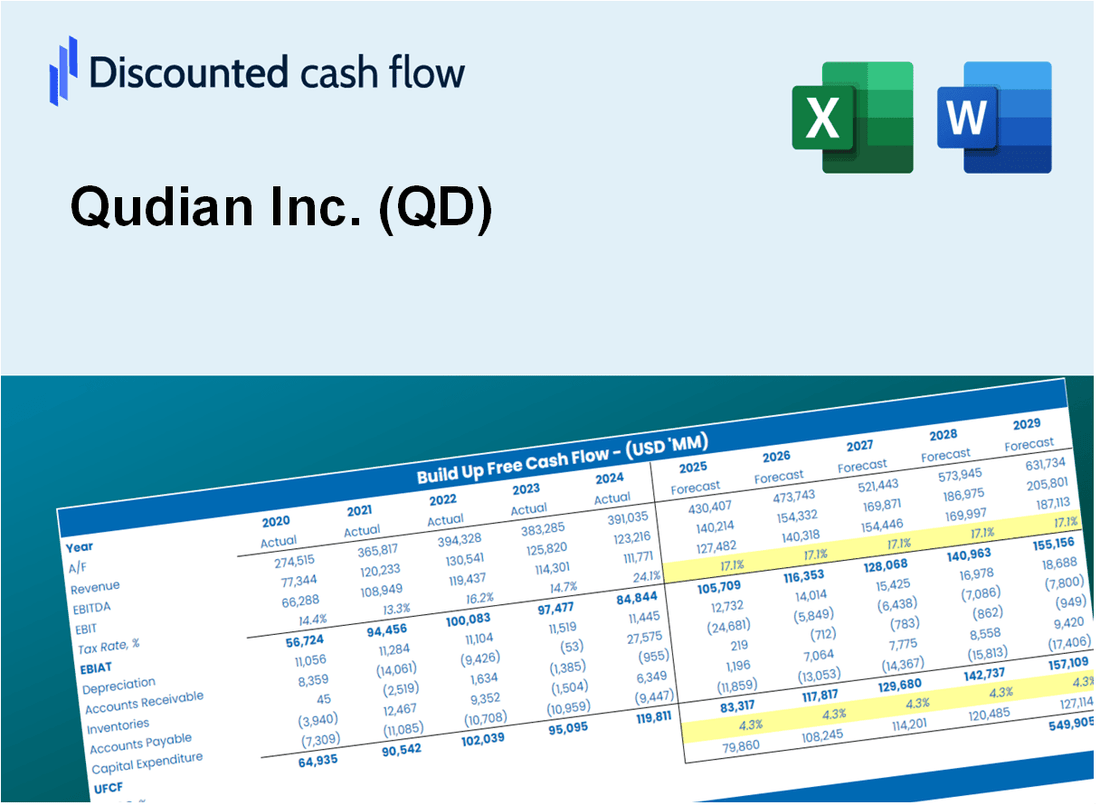
Discounted Cash Flow (DCF) - (USD MM)
| Year | AY1 2020 |
AY2 2021 |
AY3 2022 |
AY4 2023 |
AY5 2024 |
FY1 2025 |
FY2 2026 |
FY3 2027 |
FY4 2028 |
FY5 2029 |
|---|---|---|---|---|---|---|---|---|---|---|
| Revenue | 518.2 | 232.4 | 81.1 | 17.8 | 30.4 | 20.8 | 14.2 | 9.7 | 6.6 | 4.5 |
| Revenue Growth, % | 0 | -55.15 | -65.09 | -78.12 | 71.31 | -31.76 | -31.76 | -31.76 | -31.76 | -31.76 |
| EBITDA | 181.5 | 135.2 | -28.4 | 20.1 | 29.9 | 10.7 | 7.3 | 5.0 | 3.4 | 2.3 |
| EBITDA, % | 35.03 | 58.15 | -34.95 | 112.99 | 98.42 | 51.33 | 51.33 | 51.33 | 51.33 | 51.33 |
| Depreciation | 6.2 | 14.0 | 9.0 | 5.8 | 7.8 | 3.2 | 2.2 | 1.5 | 1.0 | .7 |
| Depreciation, % | 1.19 | 6.01 | 11.14 | 32.67 | 25.63 | 15.33 | 15.33 | 15.33 | 15.33 | 15.33 |
| EBIT | 175.4 | 121.2 | -37.4 | 14.3 | 22.1 | 8.0 | 5.5 | 3.7 | 2.5 | 1.7 |
| EBIT, % | 33.84 | 52.14 | -46.09 | 80.32 | 72.79 | 38.6 | 38.6 | 38.6 | 38.6 | 38.6 |
| Total Cash | 924.6 | 1,123.1 | 1,247.9 | 1,321.5 | 1,038.6 | 20.8 | 14.2 | 9.7 | 6.6 | 4.5 |
| Total Cash, percent | .0 | .0 | .0 | .0 | .0 | .0 | .0 | .0 | .0 | .0 |
| Account Receivables | 92.0 | 507.4 | .2 | 49.8 | 37.4 | 13.2 | 9.0 | 6.1 | 4.2 | 2.9 |
| Account Receivables, % | 17.75 | 218.3 | 0.23915 | 280.41 | 122.91 | 63.6 | 63.6 | 63.6 | 63.6 | 63.6 |
| Inventories | 12.9 | 2.1 | 16.4 | 1.5 | 1.5 | 1.5 | 1.0 | .7 | .5 | .3 |
| Inventories, % | 2.49 | 0.9197 | 20.21 | 8.22 | 4.93 | 7.35 | 7.35 | 7.35 | 7.35 | 7.35 |
| Accounts Payable | 7.1 | 15.4 | 15.2 | 19.1 | 19.0 | 7.9 | 5.4 | 3.7 | 2.5 | 1.7 |
| Accounts Payable, % | 1.37 | 6.64 | 18.68 | 107.34 | 62.49 | 37.83 | 37.83 | 37.83 | 37.83 | 37.83 |
| Capital Expenditure | -31.2 | -67.2 | -38.5 | -79.4 | -44.7 | -11.7 | -8.0 | -5.5 | -3.7 | -2.5 |
| Capital Expenditure, % | -6.01 | -28.93 | -47.38 | -447.23 | -146.93 | -56.46 | -56.46 | -56.46 | -56.46 | -56.46 |
| Tax Rate, % | 41.77 | 41.77 | 41.77 | 41.77 | 41.77 | 41.77 | 41.77 | 41.77 | 41.77 | 41.77 |
| EBITAT | 137.7 | 84.3 | -50.2 | 5.5 | 12.9 | 5.5 | 3.8 | 2.6 | 1.8 | 1.2 |
| Depreciation | ||||||||||
| Changes in Account Receivables | ||||||||||
| Changes in Inventories | ||||||||||
| Changes in Accounts Payable | ||||||||||
| Capital Expenditure | ||||||||||
| UFCF | 14.9 | -365.2 | 413.0 | -98.8 | -11.7 | 10.0 | .1 | .1 | .1 | .0 |
| WACC, % | 6.91 | 6.87 | 6.99 | 6.75 | 6.83 | 6.87 | 6.87 | 6.87 | 6.87 | 6.87 |
| PV UFCF | ||||||||||
| SUM PV UFCF | 9.6 | |||||||||
| Long Term Growth Rate, % | 2.00 | |||||||||
| Free cash flow (T + 1) | 0 | |||||||||
| Terminal Value | 1 | |||||||||
| Present Terminal Value | 1 | |||||||||
| Enterprise Value | 10 | |||||||||
| Net Debt | -488 | |||||||||
| Equity Value | 499 | |||||||||
| Diluted Shares Outstanding, MM | 188 | |||||||||
| Equity Value Per Share | 2.66 |
What You Will Receive
- Pre-Filled Financial Model: Qudian Inc.'s (QD) actual data facilitates accurate DCF valuation.
- Comprehensive Forecast Control: Modify revenue growth, profit margins, WACC, and other essential drivers.
- Real-Time Calculations: Automatic updates provide immediate results as you adjust inputs.
- Investor-Ready Template: A polished Excel file crafted for high-quality valuation presentations.
- Customizable and Reusable: Designed for adaptability, allowing for repeated use in detailed forecasting.
Key Features
- Pre-Loaded Data: Qudian Inc.'s historical financial statements and pre-filled forecasts.
- Fully Adjustable Inputs: Customize WACC, tax rates, revenue growth, and EBITDA margins.
- Instant Results: Observe Qudian Inc.'s intrinsic value recalculating in real time.
- Clear Visual Outputs: Dashboard charts present valuation results and key metrics.
- Built for Accuracy: A professional tool tailored for analysts, investors, and finance experts.
How It Works
- Step 1: Download the prebuilt Excel template featuring Qudian Inc.’s (QD) data.
- Step 2: Navigate through the pre-filled sheets to familiarize yourself with the essential metrics.
- Step 3: Modify forecasts and assumptions in the editable yellow cells (WACC, growth, margins).
- Step 4: Instantly view updated results, including Qudian Inc.’s (QD) intrinsic value.
- Step 5: Make well-informed investment choices or create reports based on the outputs.
Why Choose Qudian Inc. (QD)?
- Streamlined Process: Quickly access financial insights without the hassle of building a model from the ground up.
- Enhanced Precision: Utilize accurate financial data and established formulas to minimize valuation errors.
- Completely Adjustable: Modify the model to suit your specific assumptions and forecasts.
- User-Friendly: Intuitive charts and outputs allow for straightforward analysis of results.
- Preferred by Professionals: Crafted for experts who prioritize accuracy and functionality.
Who Should Use This Product?
- Finance Students: Discover valuation methodologies and practice with live data relevant to Qudian Inc. (QD).
- Academics: Integrate advanced financial models into your teaching materials or research focused on Qudian Inc. (QD).
- Investors: Validate your investment hypotheses and evaluate valuation scenarios for Qudian Inc. (QD).
- Analysts: Enhance your analysis processes with a ready-to-use, adaptable DCF model tailored for Qudian Inc. (QD).
- Small Business Owners: Understand the analytical approaches used for evaluating companies like Qudian Inc. (QD).
What the Template Contains
- Pre-Filled DCF Model: Qudian Inc.’s (QD) financial data preloaded for immediate use.
- WACC Calculator: Detailed calculations for Weighted Average Cost of Capital.
- Financial Ratios: Evaluate Qudian Inc.’s (QD) profitability, leverage, and efficiency.
- Editable Inputs: Change assumptions such as growth, margins, and CAPEX to fit your scenarios.
- Financial Statements: Annual and quarterly reports to support detailed analysis.
- Interactive Dashboard: Easily visualize key valuation metrics and results.
Disclaimer
All information, articles, and product details provided on this website are for general informational and educational purposes only. We do not claim any ownership over, nor do we intend to infringe upon, any trademarks, copyrights, logos, brand names, or other intellectual property mentioned or depicted on this site. Such intellectual property remains the property of its respective owners, and any references here are made solely for identification or informational purposes, without implying any affiliation, endorsement, or partnership.
We make no representations or warranties, express or implied, regarding the accuracy, completeness, or suitability of any content or products presented. Nothing on this website should be construed as legal, tax, investment, financial, medical, or other professional advice. In addition, no part of this site—including articles or product references—constitutes a solicitation, recommendation, endorsement, advertisement, or offer to buy or sell any securities, franchises, or other financial instruments, particularly in jurisdictions where such activity would be unlawful.
All content is of a general nature and may not address the specific circumstances of any individual or entity. It is not a substitute for professional advice or services. Any actions you take based on the information provided here are strictly at your own risk. You accept full responsibility for any decisions or outcomes arising from your use of this website and agree to release us from any liability in connection with your use of, or reliance upon, the content or products found herein.