
|
Quidelortho Corporation (QDEL) DCF -Bewertung |
Fully Editable: Tailor To Your Needs In Excel Or Sheets
Professional Design: Trusted, Industry-Standard Templates
Investor-Approved Valuation Models
MAC/PC Compatible, Fully Unlocked
No Expertise Is Needed; Easy To Follow
QuidelOrtho Corporation (QDEL) Bundle
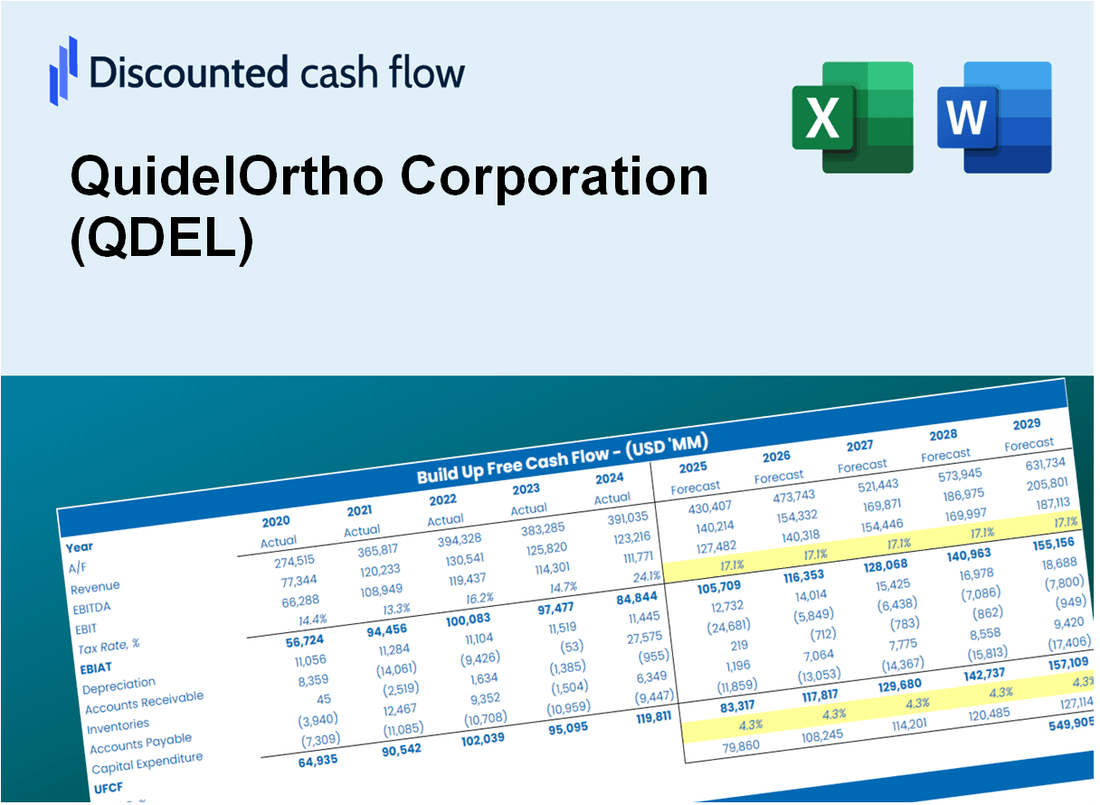
Vereinfachen Sie die Bewertung der Quidelortho Corporation (QDEL) mit diesem anpassbaren DCF -Taschenrechner! Mit Real Quidelortho Corporation (QDEL) Finanzdaten und einstellbaren Prognoseeingaben können Sie die Szenarien testen und die Fair -Wert der Quidelortho Corporation (QDEL) in Minuten aufdecken.
What You Will Get
- Real QDEL Financials: Access to historical and projected data for precise valuation.
- Customizable Inputs: Adjust WACC, tax rates, revenue growth, and capital expenditures as needed.
- Automatic Calculations: Dynamic calculations for intrinsic value and NPV.
- Scenario Analysis: Evaluate various scenarios to assess QuidelOrtho’s future performance.
- Clear and Intuitive Design: Designed for professionals while remaining user-friendly for newcomers.
Key Features
- Comprehensive Financial Data: Gain access to precise pre-loaded historical performance and future forecasts for QuidelOrtho Corporation (QDEL).
- Adjustable Forecast Parameters: Modify highlighted cells for key metrics such as WACC, growth rates, and profit margins.
- Real-Time Calculations: Automatic adjustments to DCF, Net Present Value (NPV), and cash flow assessments.
- User-Friendly Dashboard: Intuitive charts and summaries to effectively present your valuation findings.
- Designed for All Users: A straightforward and accessible layout tailored for investors, CFOs, and consultants alike.
How It Works
- Download the Template: Gain immediate access to the Excel-based QDEL DCF Calculator.
- Input Your Assumptions: Modify the yellow-highlighted cells for growth rates, WACC, margins, and other variables.
- Instant Calculations: The model automatically recalculates QuidelOrtho’s intrinsic value.
- Test Scenarios: Experiment with various assumptions to assess potential changes in valuation.
- Analyze and Decide: Utilize the outcomes to inform your investment or financial decisions.
Why Choose This Calculator for QuidelOrtho Corporation (QDEL)?
- Accurate Data: Up-to-date QuidelOrtho financials provide dependable valuation outcomes.
- Customizable: Tailor critical variables such as growth rates, WACC, and tax rates to fit your forecasts.
- Time-Saving: Pre-configured calculations save you the hassle of starting from the ground up.
- Professional-Grade Tool: Crafted for investors, analysts, and consultants in the healthcare sector.
- User-Friendly: Easy-to-navigate design and clear instructions ensure accessibility for all users.
Who Should Use This Product?
- Healthcare Professionals: Understand diagnostic testing methodologies and their applications in real-world scenarios.
- Researchers: Utilize advanced models for studies and incorporate them into your health-related research.
- Investors: Evaluate your investment strategies and analyze the market performance of QuidelOrtho Corporation (QDEL).
- Analysts: Enhance your analysis process with a customizable financial model tailored for the diagnostics sector.
- Medical Device Entrepreneurs: Learn from the operational strategies of established companies like QuidelOrtho Corporation.
What the Template Contains
- Comprehensive DCF Model: Editable template with detailed valuation calculations tailored for QuidelOrtho Corporation (QDEL).
- Real-World Data: QuidelOrtho’s historical and projected financials preloaded for thorough analysis.
- Customizable Parameters: Adjust WACC, growth rates, and tax assumptions to explore different scenarios.
- Financial Statements: Complete annual and quarterly breakdowns for enhanced insights into performance.
- Key Ratios: Built-in analysis for profitability, efficiency, and leverage specific to QuidelOrtho Corporation (QDEL).
- Dashboard with Visual Outputs: Charts and tables designed for clear, actionable results regarding QuidelOrtho Corporation (QDEL).
Disclaimer
All information, articles, and product details provided on this website are for general informational and educational purposes only. We do not claim any ownership over, nor do we intend to infringe upon, any trademarks, copyrights, logos, brand names, or other intellectual property mentioned or depicted on this site. Such intellectual property remains the property of its respective owners, and any references here are made solely for identification or informational purposes, without implying any affiliation, endorsement, or partnership.
We make no representations or warranties, express or implied, regarding the accuracy, completeness, or suitability of any content or products presented. Nothing on this website should be construed as legal, tax, investment, financial, medical, or other professional advice. In addition, no part of this site—including articles or product references—constitutes a solicitation, recommendation, endorsement, advertisement, or offer to buy or sell any securities, franchises, or other financial instruments, particularly in jurisdictions where such activity would be unlawful.
All content is of a general nature and may not address the specific circumstances of any individual or entity. It is not a substitute for professional advice or services. Any actions you take based on the information provided here are strictly at your own risk. You accept full responsibility for any decisions or outcomes arising from your use of this website and agree to release us from any liability in connection with your use of, or reliance upon, the content or products found herein.