
|
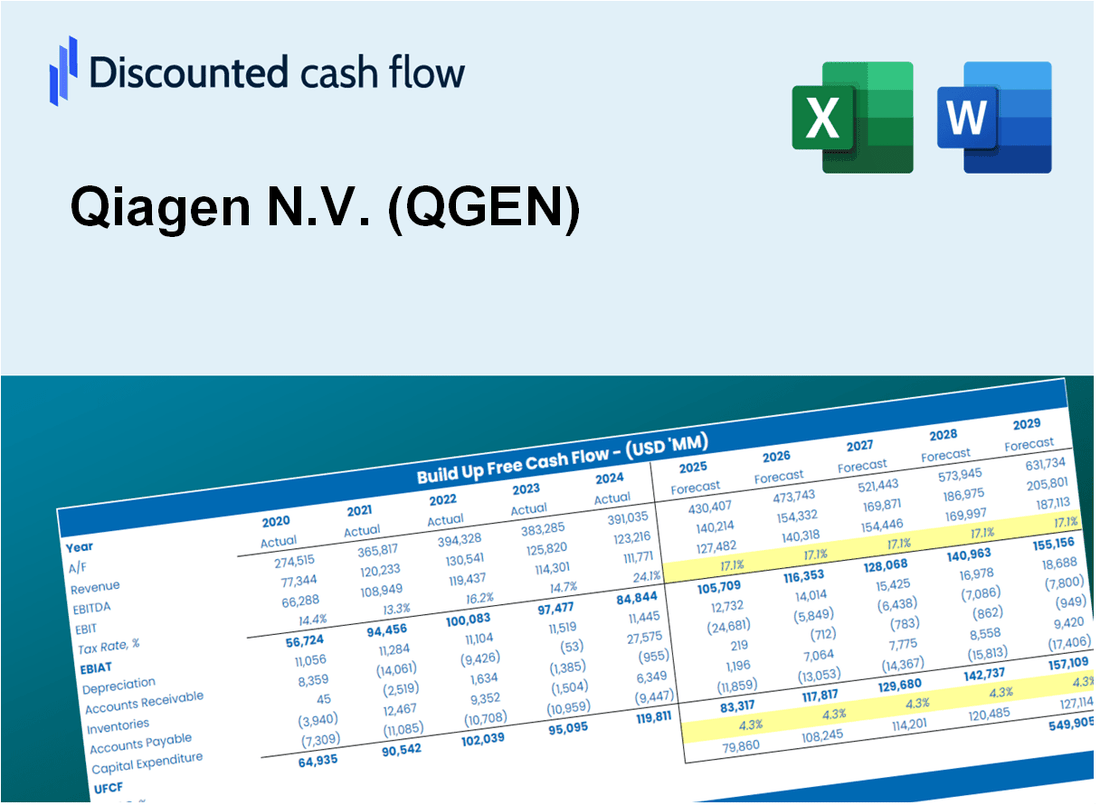
Qiagen N.V. (QGen) DCF -Bewertung |
Fully Editable: Tailor To Your Needs In Excel Or Sheets
Professional Design: Trusted, Industry-Standard Templates
Investor-Approved Valuation Models
MAC/PC Compatible, Fully Unlocked
No Expertise Is Needed; Easy To Follow
Qiagen N.V. (QGEN) Bundle
Als Anleger oder Analyst ist dieser [QGen] DCF-Taschenrechner Ihre Anlaufstelle für eine genaue Bewertung. Mit realen Daten von Qiagen N.V. können Sie problemlos Prognosen anpassen und die Auswirkungen sofort beobachten.
What You Will Get
- Real QGEN Financials: Access to both historical and projected data for precise valuation.
- Customizable Inputs: Adjust WACC, tax rates, revenue growth, and capital expenditures as needed.
- Dynamic Calculations: Intrinsic value and NPV are computed automatically.
- Scenario Analysis: Evaluate various scenarios to assess Qiagen’s future performance.
- User-Friendly Design: Designed for professionals but easy for beginners to navigate.
Key Features
- 🔍 Real-Life QGEN Financials: Pre-filled historical and projected data for Qiagen N.V.
- ✏️ Fully Customizable Inputs: Adjust all critical parameters (yellow cells) like WACC, growth %, and tax rates.
- 📊 Professional DCF Valuation: Built-in formulas calculate Qiagen’s intrinsic value using the Discounted Cash Flow method.
- ⚡ Instant Results: Visualize Qiagen’s valuation instantly after making changes.
- Scenario Analysis: Test and compare outcomes for various financial assumptions side-by-side.
How It Works
- Download: Obtain the pre-built Excel file containing Qiagen N.V.'s (QGEN) financial data.
- Customize: Modify projections, including revenue growth rates, EBITDA %, and WACC.
- Update Automatically: The intrinsic value and NPV calculations refresh in real-time.
- Test Scenarios: Generate various forecasts and instantly compare the results.
- Make Decisions: Leverage the valuation findings to inform your investment approach.
Why Choose the Qiagen N.V. ([QGEN]) Calculator?
- Accuracy: Utilizes real Qiagen financial data to ensure precise calculations.
- Flexibility: Built for users to easily experiment with and adjust inputs as needed.
- Time-Saving: Eliminate the need to construct a DCF model from the ground up.
- Professional-Grade: Crafted with the expertise and usability expected at the CFO level.
- User-Friendly: Intuitive enough for anyone, regardless of their financial modeling background.
Who Should Use This Product?
- Professional Investors: Develop comprehensive and accurate valuation models for analyzing Qiagen N.V. (QGEN) investments.
- Corporate Finance Teams: Evaluate valuation scenarios to inform strategic decisions within the organization.
- Consultants and Advisors: Deliver precise valuation insights for clients interested in Qiagen N.V. (QGEN) stock.
- Students and Educators: Utilize real-time data to enhance learning and practice in financial modeling.
- Biotech Enthusiasts: Gain insights into how biotech companies like Qiagen N.V. (QGEN) are assessed in the financial markets.
What the Qiagen Template Contains
- Preloaded QGEN Data: Historical and projected financial data, including revenue, EBIT, and capital expenditures.
- DCF and WACC Models: Professional-grade sheets for calculating intrinsic value and Weighted Average Cost of Capital.
- Editable Inputs: Yellow-highlighted cells for adjusting revenue growth, tax rates, and discount rates.
- Financial Statements: Comprehensive annual and quarterly financials for deeper analysis.
- Key Ratios: Profitability, leverage, and efficiency ratios to evaluate performance.
- Dashboard and Charts: Visual summaries of valuation outcomes and assumptions.
Disclaimer
All information, articles, and product details provided on this website are for general informational and educational purposes only. We do not claim any ownership over, nor do we intend to infringe upon, any trademarks, copyrights, logos, brand names, or other intellectual property mentioned or depicted on this site. Such intellectual property remains the property of its respective owners, and any references here are made solely for identification or informational purposes, without implying any affiliation, endorsement, or partnership.
We make no representations or warranties, express or implied, regarding the accuracy, completeness, or suitability of any content or products presented. Nothing on this website should be construed as legal, tax, investment, financial, medical, or other professional advice. In addition, no part of this site—including articles or product references—constitutes a solicitation, recommendation, endorsement, advertisement, or offer to buy or sell any securities, franchises, or other financial instruments, particularly in jurisdictions where such activity would be unlawful.
All content is of a general nature and may not address the specific circumstances of any individual or entity. It is not a substitute for professional advice or services. Any actions you take based on the information provided here are strictly at your own risk. You accept full responsibility for any decisions or outcomes arising from your use of this website and agree to release us from any liability in connection with your use of, or reliance upon, the content or products found herein.