
|
Restaurant Brands International Inc. (QSR) DCF -Bewertung |
Fully Editable: Tailor To Your Needs In Excel Or Sheets
Professional Design: Trusted, Industry-Standard Templates
Investor-Approved Valuation Models
MAC/PC Compatible, Fully Unlocked
No Expertise Is Needed; Easy To Follow
Restaurant Brands International Inc. (QSR) Bundle
Bewerten Sie die finanziellen Aussichten von Restaurant Brands International Inc. (QSR) mit fachkundiger Präzision! Dieser (QSR) DCF-Taschenrechner bietet Ihnen vorgefüllte Finanzdaten und die volle Flexibilität, um das Umsatzwachstum, WACC, Margen und andere wesentliche Annahmen zu ändern, um sich an Ihren Projektionen anzupassen.
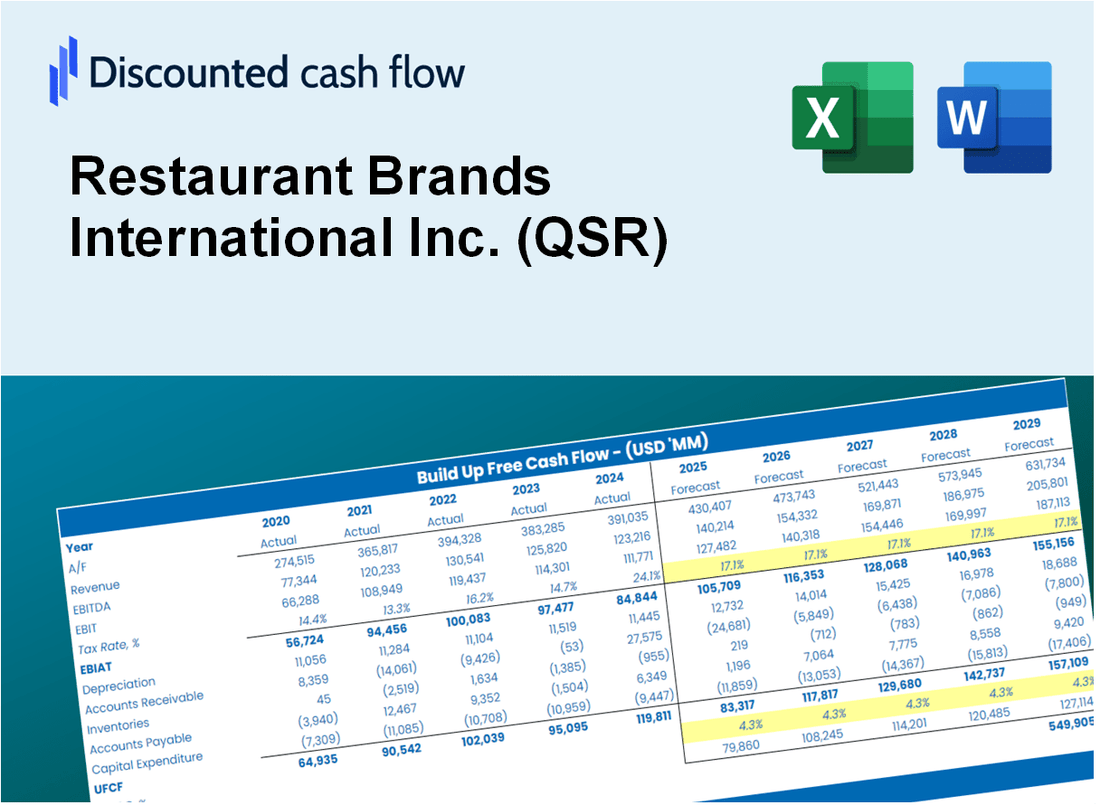
Discounted Cash Flow (DCF) - (USD MM)
| Year | AY1 2020 |
AY2 2021 |
AY3 2022 |
AY4 2023 |
AY5 2024 |
FY1 2025 |
FY2 2026 |
FY3 2027 |
FY4 2028 |
FY5 2029 |
|---|---|---|---|---|---|---|---|---|---|---|
| Revenue | 4,968.0 | 5,739.0 | 6,505.0 | 7,022.0 | 8,406.0 | 9,593.8 | 10,949.6 | 12,496.8 | 14,262.7 | 16,278.2 |
| Revenue Growth, % | 0 | 15.52 | 13.35 | 7.95 | 19.71 | 14.13 | 14.13 | 14.13 | 14.13 | 14.13 |
| EBITDA | 1,496.0 | 2,045.0 | 2,067.0 | 2,239.0 | 2,664.0 | 3,091.1 | 3,527.9 | 4,026.4 | 4,595.4 | 5,244.8 |
| EBITDA, % | 30.11 | 35.63 | 31.78 | 31.89 | 31.69 | 32.22 | 32.22 | 32.22 | 32.22 | 32.22 |
| Depreciation | 189.0 | 201.0 | 190.0 | 191.0 | 264.0 | 308.7 | 352.3 | 402.1 | 458.9 | 523.8 |
| Depreciation, % | 3.8 | 3.5 | 2.92 | 2.72 | 3.14 | 3.22 | 3.22 | 3.22 | 3.22 | 3.22 |
| EBIT | 1,307.0 | 1,844.0 | 1,877.0 | 2,048.0 | 2,400.0 | 2,782.4 | 3,175.6 | 3,624.3 | 4,136.5 | 4,721.0 |
| EBIT, % | 26.31 | 32.13 | 28.85 | 29.17 | 28.55 | 29 | 29 | 29 | 29 | 29 |
| Total Cash | 1,560.0 | 1,087.0 | 1,178.0 | 1,139.0 | 1,334.0 | 1,929.1 | 2,201.8 | 2,512.9 | 2,868.0 | 3,273.2 |
| Total Cash, percent | .0 | .0 | .0 | .0 | .0 | .0 | .0 | .0 | .0 | .0 |
| Account Receivables | 536.0 | 547.0 | 614.0 | 749.0 | 698.0 | 935.0 | 1,067.1 | 1,217.9 | 1,390.0 | 1,586.5 |
| Account Receivables, % | 10.79 | 9.53 | 9.44 | 10.67 | 8.3 | 9.75 | 9.75 | 9.75 | 9.75 | 9.75 |
| Inventories | 96.0 | 96.0 | 133.0 | 166.0 | 142.0 | 186.2 | 212.5 | 242.5 | 276.8 | 315.9 |
| Inventories, % | 1.93 | 1.67 | 2.04 | 2.36 | 1.69 | 1.94 | 1.94 | 1.94 | 1.94 | 1.94 |
| Accounts Payable | 464.0 | 614.0 | 758.0 | 790.0 | 765.0 | 998.6 | 1,139.7 | 1,300.7 | 1,484.5 | 1,694.3 |
| Accounts Payable, % | 9.34 | 10.7 | 11.65 | 11.25 | 9.1 | 10.41 | 10.41 | 10.41 | 10.41 | 10.41 |
| Capital Expenditure | -117.0 | -106.0 | -100.0 | -120.0 | -201.0 | -188.8 | -215.5 | -245.9 | -280.7 | -320.3 |
| Capital Expenditure, % | -2.36 | -1.85 | -1.54 | -1.71 | -2.39 | -1.97 | -1.97 | -1.97 | -1.97 | -1.97 |
| Tax Rate, % | 43.56 | 43.56 | 43.56 | 43.56 | 43.56 | 43.56 | 43.56 | 43.56 | 43.56 | 43.56 |
| EBITAT | 778.4 | 1,133.7 | 1,386.1 | 1,677.3 | 1,354.6 | 1,854.4 | 2,116.4 | 2,415.5 | 2,756.8 | 3,146.3 |
| Depreciation | ||||||||||
| Changes in Account Receivables | ||||||||||
| Changes in Inventories | ||||||||||
| Changes in Accounts Payable | ||||||||||
| Capital Expenditure | ||||||||||
| UFCF | 682.4 | 1,367.7 | 1,516.1 | 1,612.3 | 1,467.6 | 1,926.6 | 2,235.9 | 2,551.9 | 2,912.5 | 3,324.0 |
| WACC, % | 5.52 | 5.55 | 5.77 | 5.91 | 5.46 | 5.64 | 5.64 | 5.64 | 5.64 | 5.64 |
| PV UFCF | ||||||||||
| SUM PV UFCF | 10,856.5 | |||||||||
| Long Term Growth Rate, % | 3.00 | |||||||||
| Free cash flow (T + 1) | 3,424 | |||||||||
| Terminal Value | 129,619 | |||||||||
| Present Terminal Value | 98,514 | |||||||||
| Enterprise Value | 109,370 | |||||||||
| Net Debt | 14,622 | |||||||||
| Equity Value | 94,748 | |||||||||
| Diluted Shares Outstanding, MM | 454 | |||||||||
| Equity Value Per Share | 208.70 |
What You Will Get
- Authentic QSR Financials: Access to historical and projected data for precise valuation.
- Customizable Inputs: Adjust parameters like WACC, tax rates, revenue growth, and capital expenditures.
- Real-Time Calculations: Intrinsic value and NPV are computed automatically.
- Scenario Analysis: Explore various scenarios to assess Restaurant Brands International Inc.'s future performance.
- User-Friendly Design: Designed for professionals while remaining approachable for newcomers.
Key Features
- Comprehensive Financial Data: Access reliable historical performance and future forecasts for Restaurant Brands International Inc. (QSR).
- Adjustable Forecast Variables: Modify highlighted fields such as WACC, growth rates, and profit margins to suit your analysis.
- Real-Time Calculations: Instant updates for DCF, Net Present Value (NPV), and cash flow assessments.
- Interactive Dashboard: User-friendly charts and summaries to effectively present your valuation findings.
- Designed for All Skill Levels: A straightforward, intuitive layout ideal for investors, CFOs, and consultants alike.
How It Works
- Download: Obtain the pre-formulated Excel file containing Restaurant Brands International Inc.'s (QSR) financial data.
- Customize: Modify projections, including sales growth, EBITDA %, and WACC.
- Update Automatically: The intrinsic value and NPV calculations refresh in real-time.
- Test Scenarios: Develop various projections and instantly compare results.
- Make Decisions: Utilize the valuation insights to inform your investment strategy.
Why Choose Restaurant Brands International Inc. (QSR)?
- Global Presence: Benefit from a strong portfolio of well-known brands across the globe.
- Proven Business Model: Leverage a successful franchise system that drives growth and profitability.
- Commitment to Innovation: Stay ahead with continuous menu development and technology enhancements.
- Focus on Quality: Enjoy high standards in food quality and customer service.
- Backed by Expertise: Rely on a management team with extensive industry experience and knowledge.
Who Should Use This Product?
- Individual Investors: Make informed decisions about buying or selling Restaurant Brands International Inc. (QSR) stock.
- Financial Analysts: Streamline valuation processes with ready-to-use financial models specific to the fast-food industry.
- Consultants: Provide clients with accurate valuation insights for quick decision-making regarding Restaurant Brands International Inc. (QSR).
- Business Owners: Gain insights into how major companies like Restaurant Brands International Inc. (QSR) are valued to inform your own business strategies.
- Finance Students: Explore valuation techniques using real-world data and scenarios related to the restaurant sector.
What the Template Contains
- Comprehensive DCF Model: Editable template featuring detailed valuation calculations.
- Real-World Data: Restaurant Brands International Inc.’s (QSR) historical and projected financials preloaded for analysis.
- Customizable Parameters: Adjust WACC, growth rates, and tax assumptions to test various scenarios.
- Financial Statements: Complete annual and quarterly breakdowns for in-depth insights.
- Key Ratios: Integrated analysis for profitability, efficiency, and leverage metrics.
- Dashboard with Visual Outputs: Charts and tables providing clear, actionable results.
Disclaimer
All information, articles, and product details provided on this website are for general informational and educational purposes only. We do not claim any ownership over, nor do we intend to infringe upon, any trademarks, copyrights, logos, brand names, or other intellectual property mentioned or depicted on this site. Such intellectual property remains the property of its respective owners, and any references here are made solely for identification or informational purposes, without implying any affiliation, endorsement, or partnership.
We make no representations or warranties, express or implied, regarding the accuracy, completeness, or suitability of any content or products presented. Nothing on this website should be construed as legal, tax, investment, financial, medical, or other professional advice. In addition, no part of this site—including articles or product references—constitutes a solicitation, recommendation, endorsement, advertisement, or offer to buy or sell any securities, franchises, or other financial instruments, particularly in jurisdictions where such activity would be unlawful.
All content is of a general nature and may not address the specific circumstances of any individual or entity. It is not a substitute for professional advice or services. Any actions you take based on the information provided here are strictly at your own risk. You accept full responsibility for any decisions or outcomes arising from your use of this website and agree to release us from any liability in connection with your use of, or reliance upon, the content or products found herein.