
|
Rajesh Exports Limited (RajeshExpo.NS) DCF -Bewertung |
Fully Editable: Tailor To Your Needs In Excel Or Sheets
Professional Design: Trusted, Industry-Standard Templates
Investor-Approved Valuation Models
MAC/PC Compatible, Fully Unlocked
No Expertise Is Needed; Easy To Follow
Rajesh Exports Limited (RAJESHEXPO.NS) Bundle
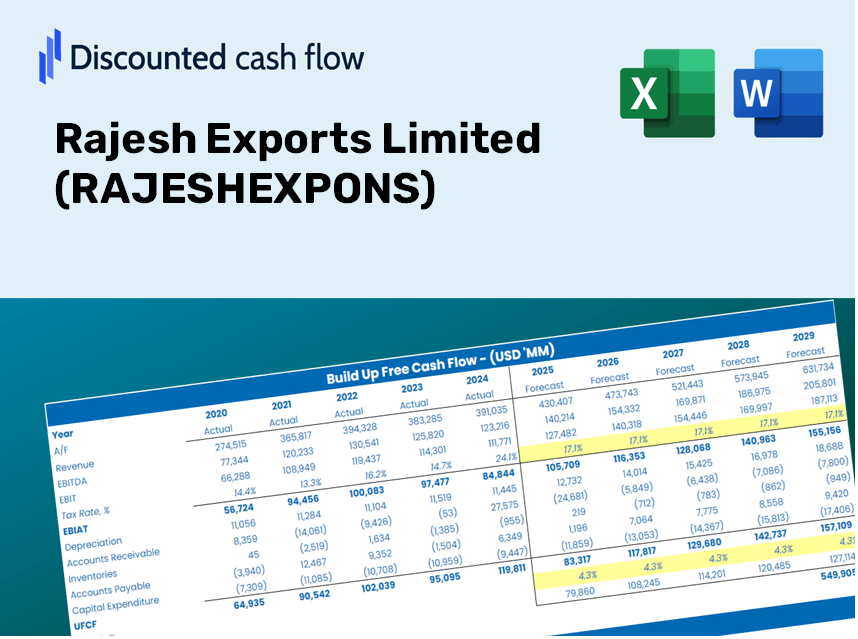
Vereinfachen Sie die begrenzte Bewertung von Rajesh Exports mit diesem anpassbaren DCF -Taschenrechner! Mit Real Rajesh Exports Limited Financials und einstellbaren Prognoseeingaben können Sie Szenarien testen und Rajesh Exports Limited Fair -Wert in Minuten aufdecken.
Discounted Cash Flow (DCF) - (USD MM)
| Year | AY1 2021 |
AY2 2022 |
AY3 2023 |
AY4 2024 |
AY5 2025 |
FY1 2026 |
FY2 2027 |
FY3 2028 |
FY4 2029 |
FY5 2030 |
|---|---|---|---|---|---|---|---|---|---|---|
| Revenue | 2,583,056.5 | 2,431,279.4 | 3,396,895.1 | 2,806,763.5 | 4,230,993.2 | 4,941,912.1 | 5,772,284.2 | 6,742,180.7 | 7,875,045.6 | 9,198,261.7 |
| Revenue Growth, % | 0 | -5.88 | 39.72 | -17.37 | 50.74 | 16.8 | 16.8 | 16.8 | 16.8 | 16.8 |
| EBITDA | 11,260.3 | 12,080.4 | 16,599.8 | 5,703.2 | 2,850.4 | 16,723.8 | 19,533.9 | 22,816.1 | 26,649.8 | 31,127.7 |
| EBITDA, % | 0.43593 | 0.49687 | 0.48868 | 0.2032 | 0.06736834 | 0.33841 | 0.33841 | 0.33841 | 0.33841 | 0.33841 |
| Depreciation | 904.3 | 908.7 | 1,005.8 | 644.4 | 453.9 | 1,341.0 | 1,566.4 | 1,829.6 | 2,137.0 | 2,496.0 |
| Depreciation, % | 0.03500938 | 0.03737707 | 0.02960795 | 0.0229573 | 0.01072774 | 0.02713589 | 0.02713589 | 0.02713589 | 0.02713589 | 0.02713589 |
| EBIT | 10,356.0 | 11,171.6 | 15,594.1 | 5,058.9 | 2,396.5 | 15,382.8 | 17,967.5 | 20,986.5 | 24,512.8 | 28,631.6 |
| EBIT, % | 0.40092 | 0.4595 | 0.45907 | 0.18024 | 0.0566406 | 0.31127 | 0.31127 | 0.31127 | 0.31127 | 0.31127 |
| Total Cash | 20,484.2 | 18,044.2 | 20,899.0 | 22,666.9 | 23,971.5 | 34,836.3 | 40,689.8 | 47,526.7 | 55,512.5 | 64,840.0 |
| Total Cash, percent | .0 | .0 | .0 | .0 | .0 | .0 | .0 | .0 | .0 | .0 |
| Account Receivables | 108,450.6 | 112,044.1 | 107,460.2 | 113,044.7 | 52,152.5 | 170,305.0 | 198,920.7 | 232,344.7 | 271,384.7 | 316,984.5 |
| Account Receivables, % | 4.2 | 4.61 | 3.16 | 4.03 | 1.23 | 3.45 | 3.45 | 3.45 | 3.45 | 3.45 |
| Inventories | 74,074.3 | 76,690.2 | 60,487.1 | 42,050.9 | 96,263.5 | 114,415.9 | 133,640.8 | 156,095.9 | 182,324.2 | 212,959.5 |
| Inventories, % | 2.87 | 3.15 | 1.78 | 1.5 | 2.28 | 2.32 | 2.32 | 2.32 | 2.32 | 2.32 |
| Accounts Payable | 110,175.7 | 104,210.0 | 71,572.9 | 59,203.8 | 124,180.2 | 155,204.6 | 181,283.1 | 211,743.5 | 247,322.0 | 288,878.6 |
| Accounts Payable, % | 4.27 | 4.29 | 2.11 | 2.11 | 2.94 | 3.14 | 3.14 | 3.14 | 3.14 | 3.14 |
| Capital Expenditure | -267.8 | -876.5 | -7,219.0 | -678.5 | -76,574.3 | -20,686.4 | -24,162.2 | -28,222.1 | -32,964.2 | -38,503.0 |
| Capital Expenditure, % | -0.01036652 | -0.03605028 | -0.21252 | -0.02417496 | -1.81 | -0.41859 | -0.41859 | -0.41859 | -0.41859 | -0.41859 |
| Tax Rate, % | 11.23 | 11.23 | 11.23 | 11.23 | 11.23 | 11.23 | 11.23 | 11.23 | 11.23 | 11.23 |
| EBITAT | 9,788.5 | 10,858.0 | 15,107.0 | 4,625.8 | 2,127.4 | 14,423.0 | 16,846.5 | 19,677.1 | 22,983.4 | 26,845.2 |
| Depreciation | ||||||||||
| Changes in Account Receivables | ||||||||||
| Changes in Inventories | ||||||||||
| Changes in Accounts Payable | ||||||||||
| Capital Expenditure | ||||||||||
| UFCF | -61,924.2 | -1,284.8 | -2,956.3 | 5,074.2 | -2,337.0 | -110,202.7 | -27,511.5 | -32,134.2 | -37,533.6 | -43,840.2 |
| WACC, % | 5.97 | 6.02 | 6.01 | 5.9 | 5.85 | 5.95 | 5.95 | 5.95 | 5.95 | 5.95 |
| PV UFCF | ||||||||||
| SUM PV UFCF | -218,166.7 | |||||||||
| Long Term Growth Rate, % | 3.50 | |||||||||
| Free cash flow (T + 1) | -45,375 | |||||||||
| Terminal Value | -1,852,359 | |||||||||
| Present Terminal Value | -1,387,488 | |||||||||
| Enterprise Value | -1,605,655 | |||||||||
| Net Debt | -2,253 | |||||||||
| Equity Value | -1,603,402 | |||||||||
| Diluted Shares Outstanding, MM | 296 | |||||||||
| Equity Value Per Share | -5,425.23 |
What You Will Receive
- Customizable Excel Template: A fully adjustable Excel-based DCF Calculator featuring pre-filled real financial data for Rajesh Exports Limited (RAJESHEXPONS).
- Authentic Data: Historical figures and future projections (displayed in the highlighted cells).
- Forecast Adaptability: Modify assumptions such as revenue growth, EBITDA %, and WACC.
- Instant Calculations: Quickly observe how your changes affect the valuation of Rajesh Exports Limited (RAJESHEXPONS).
- Professional Resource: Designed for investors, CFOs, consultants, and financial analysts.
- Intuitive Layout: Organized for clarity and convenience, complete with step-by-step guidance.
Key Features
- Comprehensive DCF Calculator: Features detailed unlevered and levered DCF valuation frameworks.
- WACC Calculator: Ready-to-use Weighted Average Cost of Capital worksheet with adjustable inputs.
- Customizable Forecast Assumptions: Adjust growth rates, capital expenditures, and discount rates as needed.
- Integrated Financial Ratios: Evaluate profitability, leverage, and efficiency ratios specific to Rajesh Exports Limited (RAJESHEXPONS).
- User-Friendly Dashboard and Charts: Visual representations highlight key valuation metrics for streamlined analysis.
How It Functions
- Download: Obtain the pre-built Excel template containing Rajesh Exports Limited's (RAJESHEXPONS) financial data.
- Customize: Tailor forecasts to include revenue growth, EBITDA percentage, and WACC.
- Update Automatically: Watch as the intrinsic value and NPV calculations refresh in real-time.
- Test Scenarios: Develop various projections and instantly compare the results.
- Make Decisions: Leverage the valuation findings to inform your investment approach.
Why Select This Calculator for Rajesh Exports Limited?
- User-Friendly: Perfectly tailored for both novice and experienced users.
- Customizable Inputs: Adjust parameters easily to suit your analysis needs.
- Real-Time Feedback: Witness immediate changes in Rajesh Exports' valuation as you tweak the inputs.
- Pre-Configured: Comes pre-loaded with Rajesh Exports' actual financial metrics for swift evaluations.
- Endorsed by Experts: Favored by investors and analysts for making well-informed choices.
Who Can Benefit from Rajesh Exports Limited (RAJESHEXPONS)?
- Investors: Make informed decisions with our premium valuation tool tailored for market analysis.
- Financial Analysts: Streamline your workflow with a ready-to-customize DCF model specific to Rajesh Exports Limited (RAJESHEXPONS).
- Consultants: Efficiently modify templates for impactful client presentations or reports on Rajesh Exports Limited (RAJESHEXPONS).
- Finance Enthusiasts: Enhance your knowledge of valuation methods through practical, real-world applications associated with Rajesh Exports Limited (RAJESHEXPONS).
- Educators and Students: Utilize this resource as a hands-on tool in finance courses focused on equity valuation.
What the Template Includes
- Historical Data: Contains Rajesh Exports Limited's past financial performance and foundational forecasts.
- DCF and Levered DCF Models: Comprehensive templates for determining the intrinsic value of Rajesh Exports Limited (RAJESHEXPONS).
- WACC Sheet: Pre-calculated metrics for the Weighted Average Cost of Capital.
- Editable Inputs: Adjust key parameters such as growth rates, EBITDA percentages, and CAPEX assumptions.
- Quarterly and Annual Statements: A thorough analysis of Rajesh Exports Limited's financial statements.
- Interactive Dashboard: Dynamically visualize valuation outcomes and projections.
Disclaimer
All information, articles, and product details provided on this website are for general informational and educational purposes only. We do not claim any ownership over, nor do we intend to infringe upon, any trademarks, copyrights, logos, brand names, or other intellectual property mentioned or depicted on this site. Such intellectual property remains the property of its respective owners, and any references here are made solely for identification or informational purposes, without implying any affiliation, endorsement, or partnership.
We make no representations or warranties, express or implied, regarding the accuracy, completeness, or suitability of any content or products presented. Nothing on this website should be construed as legal, tax, investment, financial, medical, or other professional advice. In addition, no part of this site—including articles or product references—constitutes a solicitation, recommendation, endorsement, advertisement, or offer to buy or sell any securities, franchises, or other financial instruments, particularly in jurisdictions where such activity would be unlawful.
All content is of a general nature and may not address the specific circumstances of any individual or entity. It is not a substitute for professional advice or services. Any actions you take based on the information provided here are strictly at your own risk. You accept full responsibility for any decisions or outcomes arising from your use of this website and agree to release us from any liability in connection with your use of, or reliance upon, the content or products found herein.