
|
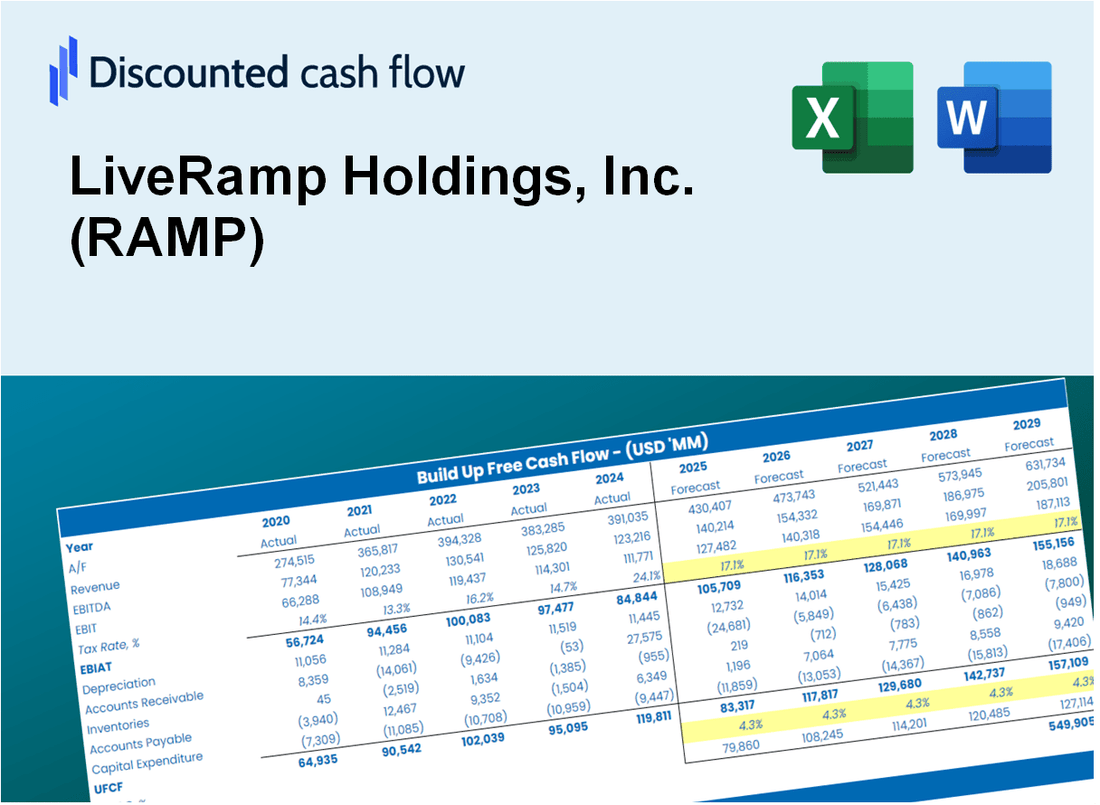
Liveramp Holdings, Inc. (RAMP) DCF -Bewertung |
Fully Editable: Tailor To Your Needs In Excel Or Sheets
Professional Design: Trusted, Industry-Standard Templates
Investor-Approved Valuation Models
MAC/PC Compatible, Fully Unlocked
No Expertise Is Needed; Easy To Follow
LiveRamp Holdings, Inc. (RAMP) Bundle
Entdecken Sie den finanziellen Ausblick von Liveramp Holdings, Inc. (RAMP) mit unserem benutzerfreundlichen DCF-Taschenrechner! Geben Sie Ihre Prognosen für Wachstum, Margen und Ausgaben ein, um den inneren Wert von Liveramp Holdings, Inc. (RAMP) zu berechnen und Ihren Investitionsansatz zu verbessern.
Discounted Cash Flow (DCF) - (USD MM)
| Year | AY1 2021 |
AY2 2022 |
AY3 2023 |
AY4 2024 |
AY5 2025 |
FY1 2026 |
FY2 2027 |
FY3 2028 |
FY4 2029 |
FY5 2030 |
|---|---|---|---|---|---|---|---|---|---|---|
| Revenue | 443.0 | 528.7 | 596.6 | 659.7 | 745.6 | 849.5 | 968.0 | 1,103.0 | 1,256.8 | 1,432.0 |
| Revenue Growth, % | 0 | 19.33 | 12.85 | 10.57 | 13.02 | 13.94 | 13.94 | 13.94 | 13.94 | 13.94 |
| EBITDA | -93.9 | -39.8 | -60.7 | 36.5 | 40.2 | -47.5 | -54.2 | -61.7 | -70.3 | -80.1 |
| EBITDA, % | -21.2 | -7.53 | -10.17 | 5.53 | 5.39 | -5.59 | -5.59 | -5.59 | -5.59 | -5.59 |
| Depreciation | 26.9 | 24.1 | 20.8 | 11.5 | 17.2 | 30.9 | 35.2 | 40.1 | 45.7 | 52.0 |
| Depreciation, % | 6.07 | 4.56 | 3.48 | 1.74 | 2.31 | 3.63 | 3.63 | 3.63 | 3.63 | 3.63 |
| EBIT | -120.8 | -63.9 | -81.5 | 25.0 | 23.0 | -78.4 | -89.3 | -101.8 | -116.0 | -132.1 |
| EBIT, % | -27.27 | -12.09 | -13.66 | 3.79 | 3.09 | -9.23 | -9.23 | -9.23 | -9.23 | -9.23 |
| Total Cash | 572.8 | 600.2 | 497.3 | 368.9 | 420.8 | 672.4 | 766.1 | 872.9 | 994.7 | 1,133.4 |
| Total Cash, percent | .0 | .0 | .0 | .0 | .0 | .0 | .0 | .0 | .0 | .0 |
| Account Receivables | 189.0 | 178.7 | 186.3 | 198.8 | 195.9 | 278.8 | 317.7 | 362.0 | 412.5 | 470.0 |
| Account Receivables, % | 42.67 | 33.8 | 31.22 | 30.14 | 26.27 | 32.82 | 32.82 | 32.82 | 32.82 | 32.82 |
| Inventories | 8.9 | .0 | .0 | .0 | .0 | 3.4 | 3.9 | 4.4 | 5.0 | 5.8 |
| Inventories, % | 2.01 | 0 | 0 | 0 | 0 | 0.40178 | 0.40178 | 0.40178 | 0.40178 | 0.40178 |
| Accounts Payable | 40.0 | 83.2 | 86.6 | 81.2 | 112.3 | 113.2 | 129.0 | 147.0 | 167.5 | 190.8 |
| Accounts Payable, % | 9.02 | 15.74 | 14.51 | 12.31 | 15.06 | 13.33 | 13.33 | 13.33 | 13.33 | 13.33 |
| Capital Expenditure | -2.2 | -4.5 | -4.7 | -4.3 | -1.0 | -5.0 | -5.6 | -6.4 | -7.3 | -8.4 |
| Capital Expenditure, % | -0.49252 | -0.85102 | -0.78715 | -0.64503 | -0.13976 | -0.5831 | -0.5831 | -0.5831 | -0.5831 | -0.5831 |
| Tax Rate, % | 103.56 | 103.56 | 103.56 | 103.56 | 103.56 | 103.56 | 103.56 | 103.56 | 103.56 | 103.56 |
| EBITAT | -90.3 | -61.6 | -85.1 | 8.6 | -.8 | -47.9 | -54.6 | -62.2 | -70.9 | -80.8 |
| Depreciation | ||||||||||
| Changes in Account Receivables | ||||||||||
| Changes in Inventories | ||||||||||
| Changes in Accounts Payable | ||||||||||
| Capital Expenditure | ||||||||||
| UFCF | -223.5 | 20.4 | -73.2 | -2.0 | 49.4 | -107.4 | -48.7 | -55.5 | -63.2 | -72.0 |
| WACC, % | 7.86 | 7.88 | 7.88 | 7.83 | 7.81 | 7.85 | 7.85 | 7.85 | 7.85 | 7.85 |
| PV UFCF | ||||||||||
| SUM PV UFCF | -281.7 | |||||||||
| Long Term Growth Rate, % | 2.00 | |||||||||
| Free cash flow (T + 1) | -73 | |||||||||
| Terminal Value | -1,255 | |||||||||
| Present Terminal Value | -860 | |||||||||
| Enterprise Value | -1,141 | |||||||||
| Net Debt | -377 | |||||||||
| Equity Value | -764 | |||||||||
| Diluted Shares Outstanding, MM | 67 | |||||||||
| Equity Value Per Share | -11.36 |
What You Will Get
- Editable Forecast Inputs: Easily adjust assumptions (growth %, margins, WACC) to explore various scenarios.
- Real-World Data: LiveRamp's financial data pre-filled to kickstart your analysis.
- Automatic DCF Outputs: The template computes Net Present Value (NPV) and intrinsic value automatically.
- Customizable and Professional: A refined Excel model that caters to your valuation requirements.
- Built for Analysts and Investors: Perfect for evaluating projections, confirming strategies, and enhancing efficiency.
Key Features
- Comprehensive RAMP Data: Pre-loaded with LiveRamp's historical performance metrics and future growth predictions.
- Customizable Assumptions: Modify parameters such as revenue growth rates, profit margins, discount rates, tax implications, and capital investments.
- Adaptive Valuation Framework: Instantaneous updates to Net Present Value (NPV) and fair value based on user-defined inputs.
- Scenario Analysis: Develop various forecasting scenarios to explore multiple valuation possibilities.
- Intuitive Interface: Designed for ease of use, catering to both experienced professionals and newcomers.
How It Works
- Step 1: Download the prebuilt Excel template with LiveRamp Holdings, Inc. (RAMP) data included.
- Step 2: Explore the pre-filled sheets and familiarize yourself with the key metrics.
- Step 3: Update forecasts and assumptions in the editable yellow cells (WACC, growth, margins).
- Step 4: Instantly view recalculated results, including LiveRamp Holdings, Inc. (RAMP)'s intrinsic value.
- Step 5: Make informed investment decisions or generate reports using the outputs.
Why Choose This Calculator for LiveRamp Holdings, Inc. (RAMP)?
- Accurate Data: Up-to-date LiveRamp financials provide dependable valuation outcomes.
- Customizable: Tailor essential parameters such as growth rates, WACC, and tax rates to align with your forecasts.
- Time-Saving: Built-in calculations save you from starting from the ground up.
- Professional-Grade Tool: Crafted for investors, analysts, and consultants in the field.
- User-Friendly: An intuitive design and clear instructions make it accessible for all users.
Who Should Use This Product?
- Investors: Accurately assess LiveRamp’s fair value before making investment choices.
- CFOs: Utilize a professional-grade DCF model for financial analysis and reporting.
- Consultants: Efficiently customize the template for valuation reports for clients.
- Entrepreneurs: Acquire insights into financial modeling practices used by leading companies.
- Educators: Employ it as a teaching resource to illustrate valuation techniques.
What the Template Contains
- Comprehensive DCF Model: Editable template with detailed valuation calculations tailored for LiveRamp Holdings, Inc. (RAMP).
- Real-World Data: LiveRamp's historical and projected financials preloaded for thorough analysis.
- Customizable Parameters: Adjust WACC, growth rates, and tax assumptions to explore various scenarios.
- Financial Statements: Complete annual and quarterly breakdowns for enhanced insights into performance.
- Key Ratios: Integrated analysis for assessing profitability, efficiency, and leverage metrics.
- Dashboard with Visual Outputs: Visual representations through charts and tables for clear, actionable results.
Disclaimer
All information, articles, and product details provided on this website are for general informational and educational purposes only. We do not claim any ownership over, nor do we intend to infringe upon, any trademarks, copyrights, logos, brand names, or other intellectual property mentioned or depicted on this site. Such intellectual property remains the property of its respective owners, and any references here are made solely for identification or informational purposes, without implying any affiliation, endorsement, or partnership.
We make no representations or warranties, express or implied, regarding the accuracy, completeness, or suitability of any content or products presented. Nothing on this website should be construed as legal, tax, investment, financial, medical, or other professional advice. In addition, no part of this site—including articles or product references—constitutes a solicitation, recommendation, endorsement, advertisement, or offer to buy or sell any securities, franchises, or other financial instruments, particularly in jurisdictions where such activity would be unlawful.
All content is of a general nature and may not address the specific circumstances of any individual or entity. It is not a substitute for professional advice or services. Any actions you take based on the information provided here are strictly at your own risk. You accept full responsibility for any decisions or outcomes arising from your use of this website and agree to release us from any liability in connection with your use of, or reliance upon, the content or products found herein.