
|
Rapt Therapeutics, Inc. (RAPT) DCF -Bewertung |
Fully Editable: Tailor To Your Needs In Excel Or Sheets
Professional Design: Trusted, Industry-Standard Templates
Investor-Approved Valuation Models
MAC/PC Compatible, Fully Unlocked
No Expertise Is Needed; Easy To Follow
RAPT Therapeutics, Inc. (RAPT) Bundle
Unser DCF -Taschenrechner (RAPT) für Genauigkeit entwickelt und ermöglicht es Ihnen, die Bewertung von Rapt Therapeutics, Inc. unter Verwendung der aktuellen Finanzdaten zu bewerten und vollständige Flexibilität zu bieten, um alle wesentlichen Parameter für erweiterte Projektionen zu ändern.
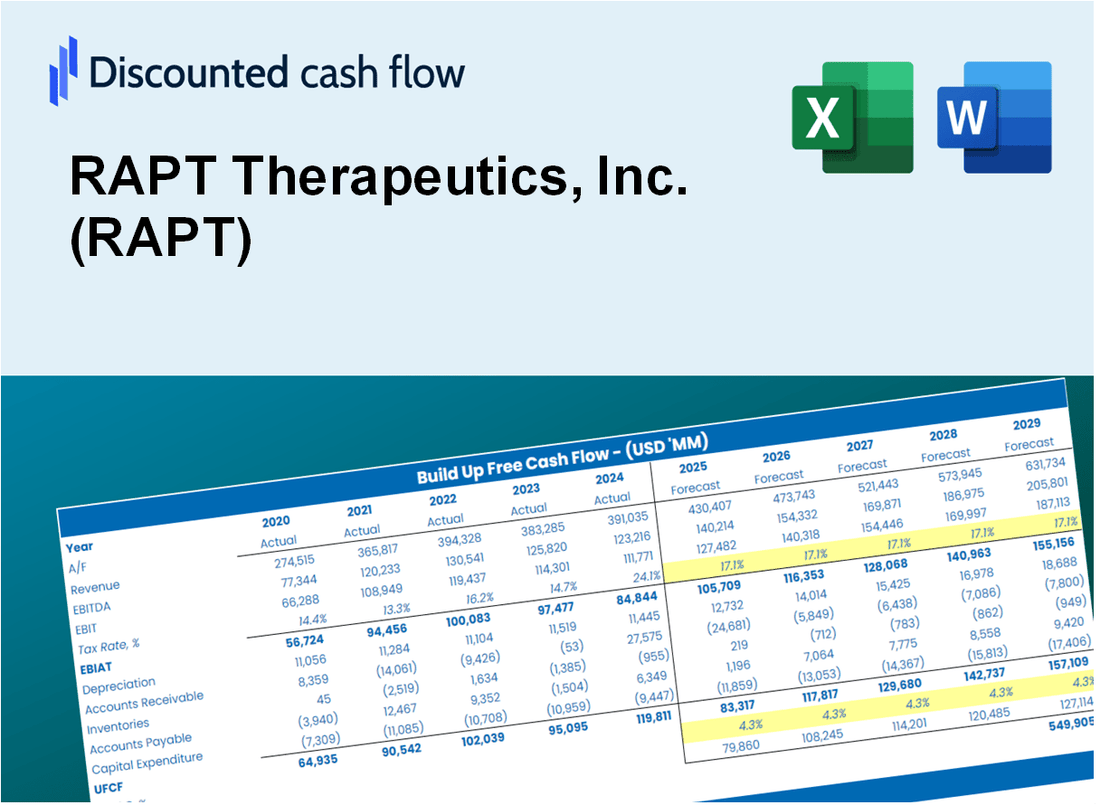
Discounted Cash Flow (DCF) - (USD MM)
| Year | AY1 2020 |
AY2 2021 |
AY3 2022 |
AY4 2023 |
AY5 2024 |
FY1 2025 |
FY2 2026 |
FY3 2027 |
FY4 2028 |
FY5 2029 |
|---|---|---|---|---|---|---|---|---|---|---|
| Revenue | 5.0 | 3.8 | 1.5 | .0 | .0 | .0 | .0 | .0 | .0 | .0 |
| Revenue Growth, % | 0 | -24.38 | -59.95 | -100 | 0 | -46.08 | -46.08 | -46.08 | -46.08 | -46.08 |
| EBITDA | -52.1 | -68.2 | -84.7 | -125.8 | -134.9 | .0 | .0 | .0 | .0 | .0 |
| EBITDA, % | -1033.14 | -1788.96 | -5549.97 | 100 | 100 | -20 | -20 | -20 | -20 | -20 |
| Depreciation | 1.1 | 1.0 | 1.0 | 1.2 | 1.2 | .0 | .0 | .0 | .0 | .0 |
| Depreciation, % | 22.27 | 26.12 | 68.57 | 100 | 100 | 63.39 | 63.39 | 63.39 | 63.39 | 63.39 |
| EBIT | -53.2 | -69.2 | -85.8 | -127.1 | -136.1 | .0 | .0 | .0 | .0 | .0 |
| EBIT, % | -1055.41 | -1815.08 | -5618.53 | 100 | 100 | -20 | -20 | -20 | -20 | -20 |
| Total Cash | 111.5 | 189.7 | 249.1 | 158.9 | 231.1 | .0 | .0 | .0 | .0 | .0 |
| Total Cash, percent | .0 | .0 | .0 | .0 | .0 | .0 | .0 | .0 | .0 | .0 |
| Account Receivables | .0 | .0 | .0 | .0 | .0 | .0 | .0 | .0 | .0 | .0 |
| Account Receivables, % | 0 | 0 | 0 | 100 | 100 | 40 | 40 | 40 | 40 | 40 |
| Inventories | .0 | .0 | .0 | .0 | .0 | .0 | .0 | .0 | .0 | .0 |
| Inventories, % | 0 | 0 | 0 | 100 | 100 | 40 | 40 | 40 | 40 | 40 |
| Accounts Payable | 2.4 | 2.0 | 3.4 | 5.2 | 1.3 | .0 | .0 | .0 | .0 | .0 |
| Accounts Payable, % | 47.26 | 52.43 | 220.37 | 100 | 100 | 79.94 | 79.94 | 79.94 | 79.94 | 79.94 |
| Capital Expenditure | -.4 | -.8 | -.8 | -1.1 | -.1 | .0 | .0 | .0 | .0 | .0 |
| Capital Expenditure, % | -7.89 | -19.8 | -55.34 | 100 | 100 | -16.61 | -16.61 | -16.61 | -16.61 | -16.61 |
| Tax Rate, % | 0 | 0 | 0 | 0 | 0 | 0 | 0 | 0 | 0 | 0 |
| EBITAT | -54.2 | -69.2 | -85.8 | -127.1 | -136.1 | .0 | .0 | .0 | .0 | .0 |
| Depreciation | ||||||||||
| Changes in Account Receivables | ||||||||||
| Changes in Inventories | ||||||||||
| Changes in Accounts Payable | ||||||||||
| Capital Expenditure | ||||||||||
| UFCF | -51.1 | -69.4 | -84.2 | -125.2 | -138.9 | -1.3 | .0 | .0 | .0 | .0 |
| WACC, % | 5.78 | 5.78 | 5.78 | 5.78 | 5.78 | 5.78 | 5.78 | 5.78 | 5.78 | 5.78 |
| PV UFCF | ||||||||||
| SUM PV UFCF | -1.2 | |||||||||
| Long Term Growth Rate, % | 2.00 | |||||||||
| Free cash flow (T + 1) | 0 | |||||||||
| Terminal Value | 0 | |||||||||
| Present Terminal Value | 0 | |||||||||
| Enterprise Value | -1 | |||||||||
| Net Debt | -165 | |||||||||
| Equity Value | 164 | |||||||||
| Diluted Shares Outstanding, MM | 5 | |||||||||
| Equity Value Per Share | 32.19 |
What You Will Get
- Real RAPT Data: Preloaded financials – from revenue to EBIT – based on actual and projected figures for RAPT Therapeutics, Inc. (RAPT).
- Full Customization: Adjust all critical parameters (yellow cells) such as WACC, growth %, and tax rates to fit your analysis.
- Instant Valuation Updates: Automatic recalculations to assess the impact of changes on RAPT’s fair value.
- Versatile Excel Template: Designed for quick edits, scenario testing, and comprehensive projections specific to RAPT Therapeutics, Inc. (RAPT).
- Time-Saving and Accurate: Avoid the hassle of building models from scratch while ensuring precision and flexibility in your analysis.
Key Features
- Comprehensive DCF Model: Offers in-depth unlevered and levered DCF valuation frameworks.
- WACC Tool: Pre-configured Weighted Average Cost of Capital sheet with adjustable parameters.
- Customizable Forecast Inputs: Adjust growth projections, capital expenditures, and discount rates.
- Integrated Financial Ratios: Evaluate profitability, leverage, and efficiency ratios for RAPT Therapeutics, Inc. (RAPT).
- Visual Dashboard and Charts: Graphical representations highlight essential valuation metrics for streamlined analysis.
How It Works
- 1. Access the Model: Download and open the Excel file featuring RAPT Therapeutics, Inc.'s (RAPT) financial data.
- 2. Modify Assumptions: Adjust key parameters such as growth projections, discount rates, and investment costs.
- 3. Analyze Results Immediately: The DCF model automatically computes intrinsic value and net present value (NPV).
- 4. Explore Scenarios: Evaluate various forecasts to assess different valuation possibilities.
- 5. Present with Assurance: Deliver expert valuation analyses to aid your strategic decisions.
Why Choose This Calculator for RAPT Therapeutics, Inc. (RAPT)?
- User-Friendly Interface: Perfect for both novice users and seasoned professionals.
- Customizable Inputs: Effortlessly adjust parameters to suit your specific analysis needs.
- Real-Time Feedback: Instantly observe changes in RAPT’s valuation as you modify inputs.
- Preloaded Data: Comes with RAPT’s latest financial information for immediate evaluation.
- Relied Upon by Experts: Favored by investors and analysts for making well-informed choices.
Who Should Use This Product?
- Individual Investors: Make informed decisions about buying or selling RAPT Therapeutics, Inc. (RAPT) stock.
- Financial Analysts: Streamline valuation processes with ready-to-use financial models specific to RAPT Therapeutics, Inc. (RAPT).
- Consultants: Deliver professional valuation insights on RAPT Therapeutics, Inc. (RAPT) to clients quickly and accurately.
- Business Owners: Understand how biotech companies like RAPT Therapeutics, Inc. (RAPT) are valued to guide your own strategy.
- Finance Students: Learn valuation techniques using real-world data and scenarios related to RAPT Therapeutics, Inc. (RAPT).
What the Template Contains
- Pre-Filled Data: Contains RAPT Therapeutics, Inc.'s historical financials and projections.
- Discounted Cash Flow Model: An editable DCF valuation model with automated calculations.
- Weighted Average Cost of Capital (WACC): A specific sheet for calculating WACC based on user-defined inputs.
- Key Financial Ratios: Evaluate RAPT's profitability, operational efficiency, and financial leverage.
- Customizable Inputs: Easily modify revenue growth rates, profit margins, and tax assumptions.
- Clear Dashboard: Visuals and tables that summarize essential valuation outcomes.
Disclaimer
All information, articles, and product details provided on this website are for general informational and educational purposes only. We do not claim any ownership over, nor do we intend to infringe upon, any trademarks, copyrights, logos, brand names, or other intellectual property mentioned or depicted on this site. Such intellectual property remains the property of its respective owners, and any references here are made solely for identification or informational purposes, without implying any affiliation, endorsement, or partnership.
We make no representations or warranties, express or implied, regarding the accuracy, completeness, or suitability of any content or products presented. Nothing on this website should be construed as legal, tax, investment, financial, medical, or other professional advice. In addition, no part of this site—including articles or product references—constitutes a solicitation, recommendation, endorsement, advertisement, or offer to buy or sell any securities, franchises, or other financial instruments, particularly in jurisdictions where such activity would be unlawful.
All content is of a general nature and may not address the specific circumstances of any individual or entity. It is not a substitute for professional advice or services. Any actions you take based on the information provided here are strictly at your own risk. You accept full responsibility for any decisions or outcomes arising from your use of this website and agree to release us from any liability in connection with your use of, or reliance upon, the content or products found herein.