
|
Ratnamani -Metalle & Röhrchen begrenzte (Ratnamani.NS) DCF -Bewertung |
Fully Editable: Tailor To Your Needs In Excel Or Sheets
Professional Design: Trusted, Industry-Standard Templates
Investor-Approved Valuation Models
MAC/PC Compatible, Fully Unlocked
No Expertise Is Needed; Easy To Follow
Ratnamani Metals & Tubes Limited (RATNAMANI.NS) Bundle
Vereinfachen Sie Ratnamani -Metalle & Röhrchen begrenzte (Ratnamanine) Bewertung mit diesem anpassbaren DCF -Taschenrechner! Mit echten Ratnamani -Metallen & Tubes Limited (Ratnamanine) Finanzdaten und einstellbare Prognoseeingaben, Sie können Szenarien testen und Ratnamani -Metalle aufdecken & Röhrchen begrenzte (Ratnamanine) Fair -Wert in Minuten.
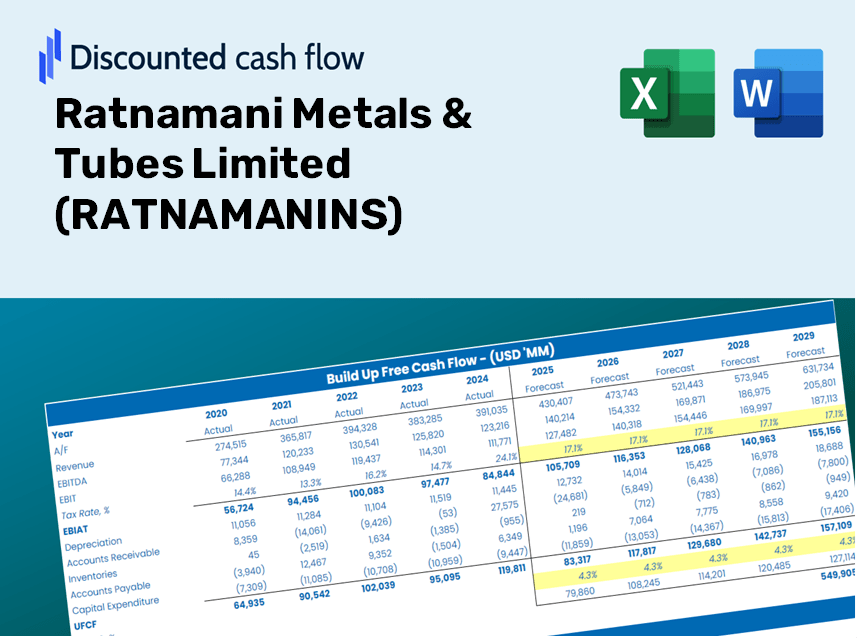
Discounted Cash Flow (DCF) - (USD MM)
| Year | AY1 2021 |
AY2 2022 |
AY3 2023 |
AY4 2024 |
AY5 2025 |
FY1 2026 |
FY2 2027 |
FY3 2028 |
FY4 2029 |
FY5 2030 |
|---|---|---|---|---|---|---|---|---|---|---|
| Revenue | 22,981.3 | 31,387.8 | 44,744.0 | 50,591.0 | 51,864.7 | 64,146.0 | 79,335.3 | 98,121.3 | 121,355.8 | 150,092.0 |
| Revenue Growth, % | 0 | 36.58 | 42.55 | 13.07 | 2.52 | 23.68 | 23.68 | 23.68 | 23.68 | 23.68 |
| EBITDA | 4,420.7 | 5,321.1 | 7,982.1 | 9,558.9 | 8,235.2 | 11,392.4 | 14,090.1 | 17,426.5 | 21,553.0 | 26,656.6 |
| EBITDA, % | 19.24 | 16.95 | 17.84 | 18.89 | 15.88 | 17.76 | 17.76 | 17.76 | 17.76 | 17.76 |
| Depreciation | 568.5 | 802.1 | 833.4 | 975.4 | 1,077.2 | 1,398.0 | 1,729.0 | 2,138.4 | 2,644.8 | 3,271.1 |
| Depreciation, % | 2.47 | 2.56 | 1.86 | 1.93 | 2.08 | 2.18 | 2.18 | 2.18 | 2.18 | 2.18 |
| EBIT | 3,852.1 | 4,519.1 | 7,148.7 | 8,583.5 | 7,158.0 | 9,994.5 | 12,361.1 | 15,288.1 | 18,908.2 | 23,385.6 |
| EBIT, % | 16.76 | 14.4 | 15.98 | 16.97 | 13.8 | 15.58 | 15.58 | 15.58 | 15.58 | 15.58 |
| Total Cash | 6,915.6 | 1,748.3 | 1,692.5 | 2,956.1 | 4,047.2 | 6,811.2 | 8,424.0 | 10,418.8 | 12,885.9 | 15,937.1 |
| Total Cash, percent | .0 | .0 | .0 | .0 | .0 | .0 | .0 | .0 | .0 | .0 |
| Account Receivables | 4,025.7 | 6,009.5 | 10,092.2 | 9,414.5 | 12,655.1 | 13,115.0 | 16,220.6 | 20,061.5 | 24,812.0 | 30,687.3 |
| Account Receivables, % | 17.52 | 19.15 | 22.56 | 18.61 | 24.4 | 20.45 | 20.45 | 20.45 | 20.45 | 20.45 |
| Inventories | 5,368.9 | 11,119.7 | 12,591.7 | 13,487.0 | 15,060.0 | 18,297.8 | 22,630.6 | 27,989.4 | 34,617.1 | 42,814.1 |
| Inventories, % | 23.36 | 35.43 | 28.14 | 26.66 | 29.04 | 28.53 | 28.53 | 28.53 | 28.53 | 28.53 |
| Accounts Payable | 2,423.3 | 3,144.9 | 3,741.9 | 3,559.9 | 4,581.2 | 5,747.0 | 7,107.9 | 8,791.0 | 10,872.6 | 13,447.2 |
| Accounts Payable, % | 10.54 | 10.02 | 8.36 | 7.04 | 8.83 | 8.96 | 8.96 | 8.96 | 8.96 | 8.96 |
| Capital Expenditure | -1,298.6 | -1,444.7 | -1,418.9 | -2,130.4 | -3,290.8 | -3,076.5 | -3,805.0 | -4,705.9 | -5,820.3 | -7,198.5 |
| Capital Expenditure, % | -5.65 | -4.6 | -3.17 | -4.21 | -6.35 | -4.8 | -4.8 | -4.8 | -4.8 | -4.8 |
| Tax Rate, % | 26.29 | 26.29 | 26.29 | 26.29 | 26.29 | 26.29 | 26.29 | 26.29 | 26.29 | 26.29 |
| EBITAT | 2,925.2 | 3,383.4 | 5,261.8 | 6,458.7 | 5,276.2 | 7,463.2 | 9,230.5 | 11,416.2 | 14,119.5 | 17,462.9 |
| Depreciation | ||||||||||
| Changes in Account Receivables | ||||||||||
| Changes in Inventories | ||||||||||
| Changes in Accounts Payable | ||||||||||
| Capital Expenditure | ||||||||||
| UFCF | -4,776.1 | -4,272.2 | -281.4 | 4,904.1 | -729.8 | 3,252.8 | 1,077.0 | 1,332.1 | 1,647.5 | 2,037.6 |
| WACC, % | 4.81 | 4.8 | 4.8 | 4.8 | 4.8 | 4.8 | 4.8 | 4.8 | 4.8 | 4.8 |
| PV UFCF | ||||||||||
| SUM PV UFCF | 8,218.8 | |||||||||
| Long Term Growth Rate, % | 4.00 | |||||||||
| Free cash flow (T + 1) | 2,119 | |||||||||
| Terminal Value | 264,037 | |||||||||
| Present Terminal Value | 208,835 | |||||||||
| Enterprise Value | 217,054 | |||||||||
| Net Debt | -678 | |||||||||
| Equity Value | 217,732 | |||||||||
| Diluted Shares Outstanding, MM | 70 | |||||||||
| Equity Value Per Share | 3,092.00 |
What You Will Receive
- Authentic Financial Data: Comprehensive financials – ranging from revenue to EBIT – derived from actual and forecasted figures for Ratnamani Metals & Tubes Limited (RATNAMANINS).
- Complete Customization: Modify all essential parameters (highlighted in yellow) such as WACC, growth rate, and tax rates according to your needs.
- Instant Valuation Updates: Automatic recalculations that allow you to assess the impact of adjustments on the fair value of Ratnamani Metals & Tubes Limited (RATNAMANINS).
- Flexible Excel Template: Designed for easy modifications, scenario analysis, and detailed forecasting.
- Efficient and Precise: Eliminate the need to construct models from scratch while ensuring accuracy and adaptability.
Key Features
- Accurate Financials for Ratnamani Metals & Tubes (RATNAMANINS): Gain access to precise historical data and future projections tailored for RATNAMANINS.
- Customizable Forecast Parameters: Modify highlighted fields for assumptions like WACC, growth rates, and profit margins.
- Real-Time Calculations: Enjoy automatic adjustments to DCF, Net Present Value (NPV), and cash flow assessments.
- Interactive Visual Dashboard: Utilize user-friendly charts and summaries to effectively visualize your valuation outcomes.
- Designed for All Levels: A straightforward and intuitive layout developed for investors, CFOs, and consultants alike.
How It Works
- Step 1: Download the prebuilt Excel template that includes Ratnamani Metals & Tubes Limited’s (RATNAMANINS) data.
- Step 2: Review the pre-filled sheets to familiarize yourself with the key performance indicators.
- Step 3: Modify forecasts and assumptions in the editable yellow cells (WACC, growth rate, margins).
- Step 4: Instantly access updated results, including the intrinsic value of Ratnamani Metals & Tubes Limited (RATNAMANINS).
- Step 5: Use the outputs to make informed investment decisions or to create detailed reports.
Why Choose This Calculator for Ratnamani Metals & Tubes Limited (RATNAMANINS)?
- User-Friendly Design: Perfect for both novices and seasoned professionals.
- Customizable Inputs: Adjust variables easily to suit your financial analysis.
- Real-Time Updates: Watch Ratnamani’s valuation change as you modify the inputs.
- Preloaded Financial Data: Comes with Ratnamani’s latest financial information for swift evaluations.
- Preferred by Experts: A go-to tool for investors and analysts seeking to make strategic decisions.
Who Can Benefit from This Product?
- Investors: Evaluate Ratnamani Metals & Tubes Limited’s (RATNAMANINS) valuation before making investment decisions.
- CFOs and Financial Analysts: Enhance valuation methodologies and validate forecasts for accuracy.
- Startup Founders: Discover how leading companies like Ratnamani Metals & Tubes Limited are appraised in the market.
- Consultants: Provide clients with comprehensive and professional valuation assessments.
- Students and Educators: Utilize authentic data to practice and teach valuation strategies effectively.
What the Template Contains for Ratnamani Metals & Tubes Limited (RATNAMANINS)
- Historical Data: Provides Ratnamani’s past financial performance and foundational forecasts.
- DCF and Levered DCF Models: Comprehensive templates for assessing Ratnamani’s intrinsic value.
- WACC Sheet: Pre-calculated metrics for Weighted Average Cost of Capital.
- Editable Inputs: Adjust crucial variables such as growth rates, EBITDA %, and CAPEX projections.
- Quarterly and Annual Statements: An in-depth analysis of Ratnamani’s financial records.
- Interactive Dashboard: Dynamic visualization of valuation outcomes and forecasts.
Disclaimer
All information, articles, and product details provided on this website are for general informational and educational purposes only. We do not claim any ownership over, nor do we intend to infringe upon, any trademarks, copyrights, logos, brand names, or other intellectual property mentioned or depicted on this site. Such intellectual property remains the property of its respective owners, and any references here are made solely for identification or informational purposes, without implying any affiliation, endorsement, or partnership.
We make no representations or warranties, express or implied, regarding the accuracy, completeness, or suitability of any content or products presented. Nothing on this website should be construed as legal, tax, investment, financial, medical, or other professional advice. In addition, no part of this site—including articles or product references—constitutes a solicitation, recommendation, endorsement, advertisement, or offer to buy or sell any securities, franchises, or other financial instruments, particularly in jurisdictions where such activity would be unlawful.
All content is of a general nature and may not address the specific circumstances of any individual or entity. It is not a substitute for professional advice or services. Any actions you take based on the information provided here are strictly at your own risk. You accept full responsibility for any decisions or outcomes arising from your use of this website and agree to release us from any liability in connection with your use of, or reliance upon, the content or products found herein.