
|
Rave Restaurant Group, Inc. (Rave) DCF -Bewertung |
Fully Editable: Tailor To Your Needs In Excel Or Sheets
Professional Design: Trusted, Industry-Standard Templates
Investor-Approved Valuation Models
MAC/PC Compatible, Fully Unlocked
No Expertise Is Needed; Easy To Follow
Rave Restaurant Group, Inc. (RAVE) Bundle
Entdecken Sie das wahre Potenzial der Rave Restaurant Group, Inc. (Rave) mit unserem fortschrittlichen DCF -Taschenrechner! Passen Sie die wichtigsten Annahmen an, erkunden Sie verschiedene Szenarien und bewerten Sie, wie unterschiedliche Faktoren die Bewertung der Rave Restaurant Group, Inc. (Rave) beeinflussen - alles innerhalb einer bequemen Excel -Vorlage.
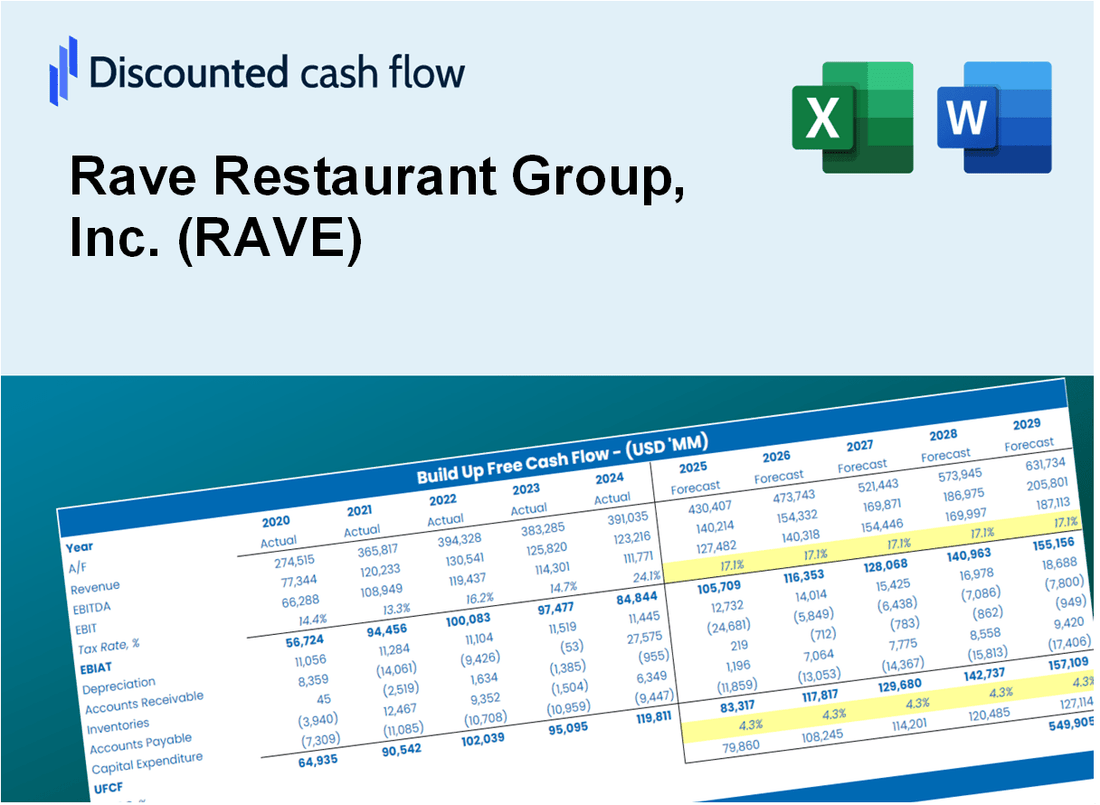
Discounted Cash Flow (DCF) - (USD MM)
| Year | AY1 2021 |
AY2 2022 |
AY3 2023 |
AY4 2024 |
AY5 2025 |
FY1 2026 |
FY2 2027 |
FY3 2028 |
FY4 2029 |
FY5 2030 |
|---|---|---|---|---|---|---|---|---|---|---|
| Revenue | 8.6 | 10.7 | 11.9 | 12.2 | 12.0 | 13.1 | 14.4 | 15.7 | 17.1 | 18.7 |
| Revenue Growth, % | 0 | 24.43 | 11.2 | 2.2 | -0.91358 | 9.23 | 9.23 | 9.23 | 9.23 | 9.23 |
| EBITDA | 2.3 | 3.0 | 2.8 | 3.6 | 4.2 | 3.8 | 4.1 | 4.5 | 4.9 | 5.3 |
| EBITDA, % | 26.99 | 28.38 | 23.61 | 29.37 | 34.5 | 28.57 | 28.57 | 28.57 | 28.57 | 28.57 |
| Depreciation | .7 | .6 | .7 | .6 | .5 | .8 | .8 | .9 | 1.0 | 1.1 |
| Depreciation, % | 8.57 | 5.69 | 5.48 | 5.18 | 4.44 | 5.87 | 5.87 | 5.87 | 5.87 | 5.87 |
| EBIT | 1.6 | 2.4 | 2.2 | 2.9 | 3.6 | 3.0 | 3.3 | 3.6 | 3.9 | 4.2 |
| EBIT, % | 18.42 | 22.69 | 18.13 | 24.19 | 30.07 | 22.7 | 22.7 | 22.7 | 22.7 | 22.7 |
| Total Cash | 8.3 | 7.7 | 5.3 | 7.8 | 9.9 | 9.5 | 10.4 | 11.3 | 12.4 | 13.5 |
| Total Cash, percent | .0 | .0 | .0 | .0 | .0 | .0 | .0 | .0 | .0 | .0 |
| Account Receivables | 1.8 | 2.2 | 1.3 | 1.5 | 1.2 | 1.9 | 2.1 | 2.3 | 2.5 | 2.8 |
| Account Receivables, % | 21.09 | 20.14 | 10.51 | 12.17 | 10.1 | 14.8 | 14.8 | 14.8 | 14.8 | 14.8 |
| Inventories | .0 | .0 | .0 | .0 | .0 | .0 | .0 | .0 | .0 | .0 |
| Inventories, % | 0.40731 | 0 | 0 | 0 | 0 | 0.08146165 | 0.08146165 | 0.08146165 | 0.08146165 | 0.08146165 |
| Accounts Payable | .6 | .7 | .5 | .4 | .2 | .6 | .7 | .7 | .8 | .8 |
| Accounts Payable, % | 7.49 | 6.26 | 4.22 | 2.95 | 1.72 | 4.53 | 4.53 | 4.53 | 4.53 | 4.53 |
| Capital Expenditure | -.3 | -.2 | -.2 | -.1 | -.1 | -.2 | -.2 | -.2 | -.3 | -.3 |
| Capital Expenditure, % | -3.33 | -1.52 | -1.97 | -0.62551 | -0.46515 | -1.58 | -1.58 | -1.58 | -1.58 | -1.58 |
| Tax Rate, % | 25.36 | 25.36 | 25.36 | 25.36 | 25.36 | 25.36 | 25.36 | 25.36 | 25.36 | 25.36 |
| EBITAT | 1.6 | 8.2 | 1.6 | 2.4 | 2.7 | 2.6 | 2.8 | 3.1 | 3.3 | 3.7 |
| Depreciation | ||||||||||
| Changes in Account Receivables | ||||||||||
| Changes in Inventories | ||||||||||
| Changes in Accounts Payable | ||||||||||
| Capital Expenditure | ||||||||||
| UFCF | .9 | 8.4 | 2.8 | 2.5 | 3.3 | 2.8 | 3.3 | 3.6 | 3.9 | 4.3 |
| WACC, % | 5.87 | 5.87 | 5.63 | 5.68 | 5.63 | 5.74 | 5.74 | 5.74 | 5.74 | 5.74 |
| PV UFCF | ||||||||||
| SUM PV UFCF | 15.0 | |||||||||
| Long Term Growth Rate, % | 0.50 | |||||||||
| Free cash flow (T + 1) | 4 | |||||||||
| Terminal Value | 82 | |||||||||
| Present Terminal Value | 62 | |||||||||
| Enterprise Value | 77 | |||||||||
| Net Debt | -2 | |||||||||
| Equity Value | 80 | |||||||||
| Diluted Shares Outstanding, MM | 15 | |||||||||
| Equity Value Per Share | 5.47 |
What You Will Get
- Editable Forecast Inputs: Easily modify key assumptions (growth %, margins, WACC) to generate various scenarios.
- Real-World Data: Rave Restaurant Group, Inc.’s (RAVE) financial data pre-loaded to facilitate your analysis.
- Automatic DCF Outputs: The template computes Net Present Value (NPV) and intrinsic value automatically.
- Customizable and Professional: A sleek Excel model that adjusts to meet your valuation requirements.
- Built for Analysts and Investors: Perfect for evaluating projections, confirming strategies, and enhancing efficiency.
Key Features
- Real-Life RAVE Data: Pre-filled with Rave Restaurant Group's historical performance and future growth projections.
- Fully Customizable Inputs: Tailor revenue growth, profit margins, discount rates, tax implications, and capital investments.
- Dynamic Valuation Model: Instant updates to Net Present Value (NPV) and intrinsic value based on your modifications.
- Scenario Testing: Develop various forecast scenarios to evaluate different valuation results.
- User-Friendly Design: Intuitive, organized, and crafted for both professionals and newcomers.
How It Works
- Step 1: Download the prebuilt Excel template featuring Rave Restaurant Group, Inc.'s (RAVE) data.
- Step 2: Navigate through the pre-filled sheets to familiarize yourself with the essential metrics.
- Step 3: Modify forecasts and assumptions in the editable yellow cells (WACC, growth, margins).
- Step 4: Instantly observe the updated results, including Rave Restaurant Group, Inc.'s (RAVE) intrinsic value.
- Step 5: Make well-informed investment choices or create reports based on the outputs.
Why Choose This Calculator for Rave Restaurant Group, Inc. (RAVE)?
- Accurate Data: Access to real financials of Rave Restaurant Group ensures trustworthy valuation outcomes.
- Customizable: Tailor essential variables such as growth rates, WACC, and tax rates to align with your forecasts.
- Time-Saving: Pre-configured calculations save you the hassle of building from the ground up.
- Professional-Grade Tool: Crafted for investors, analysts, and consultants focused on the restaurant industry.
- User-Friendly: An intuitive design and clear, step-by-step guidance make it accessible for everyone.
Who Should Use Rave Restaurant Group, Inc. (RAVE)?
- Food Industry Students: Understand market dynamics and apply them using data from RAVE.
- Researchers: Utilize RAVE's business models in academic studies or analyses.
- Investors: Evaluate your investment strategies and review performance metrics for RAVE.
- Market Analysts: Enhance your analysis with a tailored, efficient financial model for RAVE.
- Entrepreneurs: Learn from RAVE's operational strategies to improve your own restaurant ventures.
What the Template Contains
- Preloaded RAVE Data: Historical and projected financial data, including revenue, EBIT, and capital expenditures.
- DCF and WACC Models: Professional-grade sheets for calculating intrinsic value and Weighted Average Cost of Capital.
- Editable Inputs: Yellow-highlighted cells for adjusting revenue growth, tax rates, and discount rates.
- Financial Statements: Comprehensive annual and quarterly financials for deeper analysis.
- Key Ratios: Profitability, leverage, and efficiency ratios to evaluate performance.
- Dashboard and Charts: Visual summaries of valuation outcomes and assumptions.
Disclaimer
All information, articles, and product details provided on this website are for general informational and educational purposes only. We do not claim any ownership over, nor do we intend to infringe upon, any trademarks, copyrights, logos, brand names, or other intellectual property mentioned or depicted on this site. Such intellectual property remains the property of its respective owners, and any references here are made solely for identification or informational purposes, without implying any affiliation, endorsement, or partnership.
We make no representations or warranties, express or implied, regarding the accuracy, completeness, or suitability of any content or products presented. Nothing on this website should be construed as legal, tax, investment, financial, medical, or other professional advice. In addition, no part of this site—including articles or product references—constitutes a solicitation, recommendation, endorsement, advertisement, or offer to buy or sell any securities, franchises, or other financial instruments, particularly in jurisdictions where such activity would be unlawful.
All content is of a general nature and may not address the specific circumstances of any individual or entity. It is not a substitute for professional advice or services. Any actions you take based on the information provided here are strictly at your own risk. You accept full responsibility for any decisions or outcomes arising from your use of this website and agree to release us from any liability in connection with your use of, or reliance upon, the content or products found herein.