
|
RBL Bank Limited (RblBank.NS) DCF -Bewertung |
Fully Editable: Tailor To Your Needs In Excel Or Sheets
Professional Design: Trusted, Industry-Standard Templates
Investor-Approved Valuation Models
MAC/PC Compatible, Fully Unlocked
No Expertise Is Needed; Easy To Follow
RBL Bank Limited (RBLBANK.NS) Bundle
Entdecken Sie das finanzielle Potenzial der RBL Bank Limited mit unserem benutzerfreundlichen DCF-Taschenrechner! Geben Sie Ihre Prognosen für Wachstum, Margen und Ausgaben ein, um den inneren Wert von RBL Bank Limited zu berechnen und Ihre Anlageentscheidungen zu informieren.
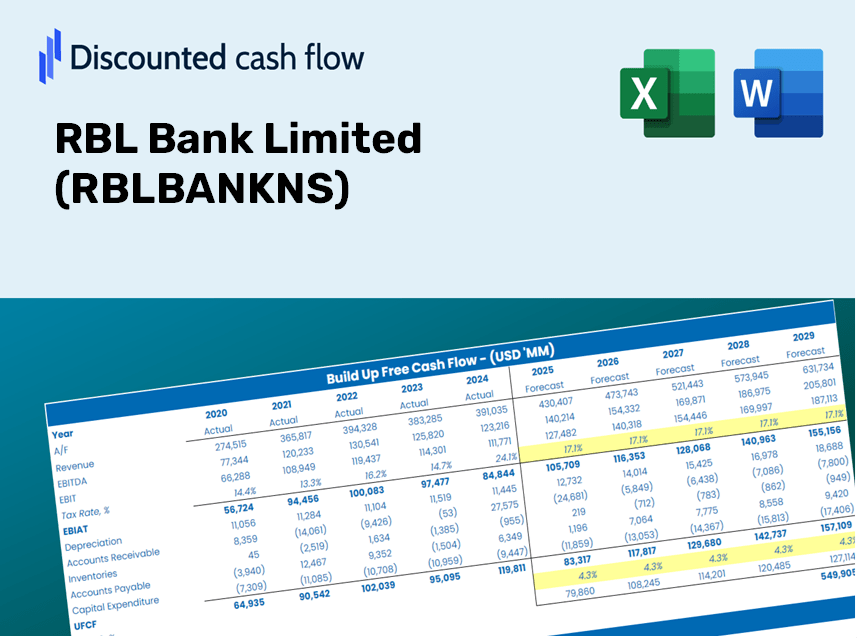
Discounted Cash Flow (DCF) - (USD MM)
| Year | AY1 2021 |
AY2 2022 |
AY3 2023 |
AY4 2024 |
AY5 2025 |
FY1 2026 |
FY2 2027 |
FY3 2028 |
FY4 2029 |
FY5 2030 |
|---|---|---|---|---|---|---|---|---|---|---|
| Revenue | 105,503.4 | 107,963.7 | 121,164.1 | 73,252.3 | 178,194.9 | 211,613.5 | 251,299.4 | 298,427.9 | 354,394.9 | 420,858.0 |
| Revenue Growth, % | 0 | 2.33 | 12.23 | -39.54 | 143.26 | 18.75 | 18.75 | 18.75 | 18.75 | 18.75 |
| EBITDA | 8,803.8 | -263.3 | 14,342.4 | 15,832.4 | 9,316.3 | 19,798.3 | 23,511.3 | 27,920.6 | 33,156.8 | 39,375.0 |
| EBITDA, % | 8.34 | -0.24388 | 11.84 | 21.61 | 5.23 | 9.36 | 9.36 | 9.36 | 9.36 | 9.36 |
| Depreciation | 1,696.1 | 1,801.6 | 2,130.9 | 2,345.2 | 2,358.4 | 4,046.1 | 4,804.9 | 5,706.0 | 6,776.1 | 8,046.9 |
| Depreciation, % | 1.61 | 1.67 | 1.76 | 3.2 | 1.32 | 1.91 | 1.91 | 1.91 | 1.91 | 1.91 |
| EBIT | 7,107.7 | -2,064.9 | 12,211.4 | 13,487.2 | 6,957.9 | 15,752.2 | 18,706.4 | 22,214.6 | 26,380.7 | 31,328.1 |
| EBIT, % | 6.74 | -1.91 | 10.08 | 18.41 | 3.9 | 7.44 | 7.44 | 7.44 | 7.44 | 7.44 |
| Total Cash | 134,428.2 | 175,572.7 | 85,271.9 | 144,234.2 | 125,663.8 | 186,599.7 | 221,594.6 | 263,152.3 | 312,503.7 | 371,110.5 |
| Total Cash, percent | .0 | .0 | .0 | .0 | .0 | .0 | .0 | .0 | .0 | .0 |
| Account Receivables | 18,274.2 | 19,490.7 | 28,627.8 | 39,251.7 | 33,384.4 | 55,578.3 | 66,001.4 | 78,379.2 | 93,078.4 | 110,534.3 |
| Account Receivables, % | 17.32 | 18.05 | 23.63 | 53.58 | 18.73 | 26.26 | 26.26 | 26.26 | 26.26 | 26.26 |
| Inventories | .0 | -183,230.8 | -123,235.4 | -159,959.9 | .0 | -126,968.1 | -150,779.6 | -179,056.7 | -212,637.0 | -252,514.8 |
| Inventories, % | 0 | -169.72 | -101.71 | -218.37 | 0 | -60 | -60 | -60 | -60 | -60 |
| Accounts Payable | 5,121.3 | 3,327.9 | 4,731.5 | 7,574.0 | 6,756.7 | 10,992.5 | 13,054.0 | 15,502.1 | 18,409.4 | 21,861.9 |
| Accounts Payable, % | 4.85 | 3.08 | 3.9 | 10.34 | 3.79 | 5.19 | 5.19 | 5.19 | 5.19 | 5.19 |
| Capital Expenditure | -1,789.7 | -2,708.0 | -2,443.3 | -2,036.4 | -2,883.3 | -4,494.3 | -5,337.2 | -6,338.1 | -7,526.7 | -8,938.3 |
| Capital Expenditure, % | -1.7 | -2.51 | -2.02 | -2.78 | -1.62 | -2.12 | -2.12 | -2.12 | -2.12 | -2.12 |
| Tax Rate, % | -3.06 | -3.06 | -3.06 | -3.06 | -3.06 | -3.06 | -3.06 | -3.06 | -3.06 | -3.06 |
| EBITAT | 5,294.7 | -1,661.4 | 9,195.4 | 12,599.0 | 7,170.6 | 13,347.4 | 15,850.5 | 18,823.1 | 22,353.2 | 26,545.3 |
| Depreciation | ||||||||||
| Changes in Account Receivables | ||||||||||
| Changes in Inventories | ||||||||||
| Changes in Accounts Payable | ||||||||||
| Capital Expenditure | ||||||||||
| UFCF | -7,951.8 | 177,653.2 | -58,846.0 | 41,851.0 | -148,264.3 | 121,909.2 | 30,768.2 | 36,538.4 | 43,390.8 | 51,528.3 |
| WACC, % | 21.22 | 22.57 | 21.41 | 25.49 | 26.97 | 23.53 | 23.53 | 23.53 | 23.53 | 23.53 |
| PV UFCF | ||||||||||
| SUM PV UFCF | 174,779.4 | |||||||||
| Long Term Growth Rate, % | 2.00 | |||||||||
| Free cash flow (T + 1) | 52,559 | |||||||||
| Terminal Value | 244,108 | |||||||||
| Present Terminal Value | 84,860 | |||||||||
| Enterprise Value | 259,640 | |||||||||
| Net Debt | 11,686 | |||||||||
| Equity Value | 247,954 | |||||||||
| Diluted Shares Outstanding, MM | 610 | |||||||||
| Equity Value Per Share | 406.65 |
What You Will Receive
- Pre-Filled Financial Model: RBL Bank Limited’s actual data facilitates accurate DCF valuation.
- Comprehensive Forecast Control: Modify revenue growth, profit margins, WACC, and other essential metrics.
- Instantaneous Calculations: Automatic updates provide real-time results as you make adjustments.
- Investor-Ready Template: A polished Excel file crafted for high-quality valuation.
- Customizable and Reusable: Designed for adaptability, enabling repeated use for in-depth forecasts.
Key Features
- Accurate RBL Financial Data: Gain access to reliable pre-loaded historical figures and forward-looking projections.
- Tailored Forecast Inputs: Modify the yellow-highlighted fields, including WACC, growth rates, and margins to fit your analysis.
- Real-Time Calculations: Enjoy automatic updates for DCF, Net Present Value (NPV), and cash flow assessments.
- User-Friendly Dashboard: View intuitive charts and summaries that help illustrate your valuation outcomes.
- Designed for All Levels: An accessible and straightforward layout tailored for investors, CFOs, and consultants alike.
How It Functions
- Step 1: Download the ready-made Excel template containing RBL Bank Limited’s (RBLBANKNS) data.
- Step 2: Review the pre-filled sheets to familiarize yourself with the important metrics.
- Step 3: Modify forecasts and assumptions in the editable yellow cells (WACC, growth, margins).
- Step 4: Instantly see the recalculated results, including the intrinsic value of RBL Bank Limited (RBLBANKNS).
- Step 5: Make well-informed investment choices or create reports based on the outputs.
Why Opt for This Calculator?
- User-Friendly Interface: Perfect for both novices and seasoned professionals.
- Customizable Inputs: Adjust parameters effortlessly to suit your analysis.
- Real-Time Updates: Monitor immediate changes to RBL Bank's valuation as you tweak inputs.
- Preloaded Data: Comes equipped with RBL Bank’s latest financial information for fast evaluation.
- Preferred by Experts: A go-to tool for investors and analysts seeking data-driven insights.
Who Can Benefit from RBL Bank Limited (RBLBANKNS)?
- Investors: Make informed investment choices with our expert financial resources.
- Financial Analysts: Enhance efficiency with our customizable financial models at your fingertips.
- Consultants: Tailor our tools swiftly for impactful client presentations and reports.
- Finance Enthusiasts: Expand your knowledge of banking and finance through practical examples.
- Educators and Students: Leverage our resources as effective learning tools in finance education.
What the Template Contains
- Preloaded RBLBANK Data: Historical and projected financial information, including revenue, EBIT, and capital expenditures.
- DCF and WACC Models: Professional-grade spreadsheets designed for calculating intrinsic value and Weighted Average Cost of Capital.
- Editable Inputs: Yellow-highlighted cells for modifying revenue growth, tax rates, and discount rates.
- Financial Statements: Detailed annual and quarterly financials for in-depth analysis.
- Key Ratios: Profitability, leverage, and efficiency ratios to assess performance.
- Dashboard and Charts: Visual representations of valuation results and underlying assumptions.
Disclaimer
All information, articles, and product details provided on this website are for general informational and educational purposes only. We do not claim any ownership over, nor do we intend to infringe upon, any trademarks, copyrights, logos, brand names, or other intellectual property mentioned or depicted on this site. Such intellectual property remains the property of its respective owners, and any references here are made solely for identification or informational purposes, without implying any affiliation, endorsement, or partnership.
We make no representations or warranties, express or implied, regarding the accuracy, completeness, or suitability of any content or products presented. Nothing on this website should be construed as legal, tax, investment, financial, medical, or other professional advice. In addition, no part of this site—including articles or product references—constitutes a solicitation, recommendation, endorsement, advertisement, or offer to buy or sell any securities, franchises, or other financial instruments, particularly in jurisdictions where such activity would be unlawful.
All content is of a general nature and may not address the specific circumstances of any individual or entity. It is not a substitute for professional advice or services. Any actions you take based on the information provided here are strictly at your own risk. You accept full responsibility for any decisions or outcomes arising from your use of this website and agree to release us from any liability in connection with your use of, or reliance upon, the content or products found herein.