
|
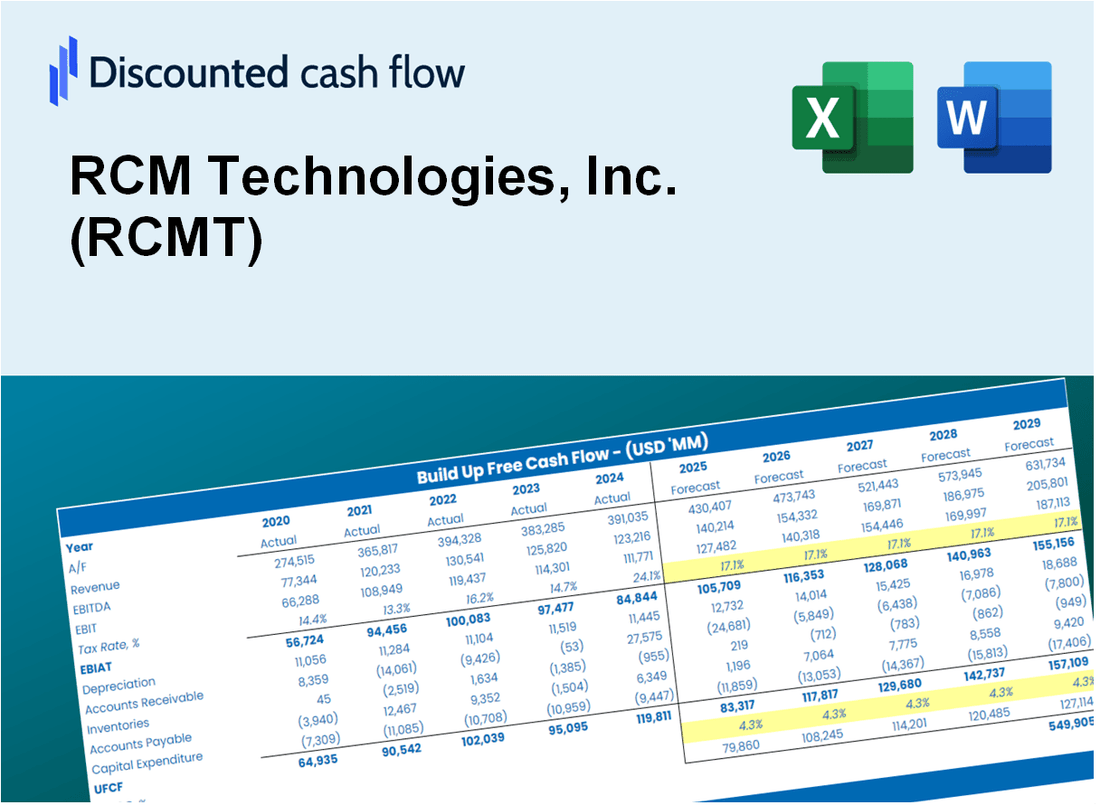
RCM Technologies, Inc. (RCMT) DCF -Bewertung |
Fully Editable: Tailor To Your Needs In Excel Or Sheets
Professional Design: Trusted, Industry-Standard Templates
Investor-Approved Valuation Models
MAC/PC Compatible, Fully Unlocked
No Expertise Is Needed; Easy To Follow
RCM Technologies, Inc. (RCMT) Bundle
Entdecken Sie den wahren Wert von RCM Technologies, Inc. (RCMT) mit unserem fortschrittlichen DCF -Taschenrechner! Passen Sie die wichtigsten Annahmen an, erkunden Sie verschiedene Szenarien und bewerten Sie, wie sich Modifikationen auf die Bewertung von RCM Technologies, Inc. (RCMT) auswirken - alles innerhalb einer umfassenden Excel -Vorlage.
What You Will Get
- Editable Forecast Inputs: Effortlessly adjust assumptions (growth %, margins, WACC) to explore various scenarios.
- Real-World Data: RCM Technologies, Inc. (RCMT) financial data pre-loaded to kickstart your analysis.
- Automatic DCF Outputs: The template computes Net Present Value (NPV) and intrinsic value for you.
- Customizable and Professional: A refined Excel model that caters to your valuation requirements.
- Built for Analysts and Investors: Perfect for evaluating projections, confirming strategies, and enhancing efficiency.
Key Features
- Comprehensive Data: RCM Technologies, Inc.'s (RCMT) historical financial reports and pre-filled projections.
- Customizable Inputs: Modify WACC, tax rates, revenue growth, and EBITDA margins to suit your analysis.
- Real-Time Insights: Observe RCM Technologies, Inc.'s (RCMT) intrinsic value update instantly.
- Intuitive Visuals: Dashboard graphs illustrate valuation outcomes and essential metrics.
- Designed for Precision: A robust tool tailored for analysts, investors, and finance professionals.
How It Works
- Step 1: Download the Excel file for RCM Technologies, Inc. (RCMT).
- Step 2: Review RCM Technologies’ pre-filled financial data and forecasts.
- Step 3: Modify essential inputs such as revenue growth, WACC, and tax rates (highlighted cells).
- Step 4: Observe the DCF model update in real-time as you adjust your assumptions.
- Step 5: Analyze the outputs and leverage the results for informed investment decisions.
Why Choose RCM Technologies, Inc. (RCMT)?
- Reliability: Proven track record of delivering accurate financial solutions.
- Adaptability: Tailored for users to experiment and adjust parameters effortlessly.
- Efficiency: Eliminate the need to create financial models from the ground up.
- Expert-Level: Crafted with the expertise and precision expected from top financial professionals.
- Intuitive: Designed for ease of use, catering to both novices and seasoned analysts alike.
Who Should Use This Product?
- Professional Investors: Develop comprehensive and accurate valuation models for portfolio management focused on RCM Technologies, Inc. (RCMT).
- Corporate Finance Teams: Evaluate valuation scenarios to inform strategic decisions within their organizations.
- Consultants and Advisors: Deliver precise valuation insights to clients interested in RCM Technologies, Inc. (RCMT).
- Students and Educators: Utilize real-world data to enhance learning and practice in financial modeling.
- Tech Enthusiasts: Gain insights into the valuation processes of technology companies like RCM Technologies, Inc. (RCMT).
What the Template Contains
- Pre-Filled Data: Contains RCM Technologies, Inc.'s historical financials and projections.
- Discounted Cash Flow Model: Editable DCF valuation model with real-time calculations.
- Weighted Average Cost of Capital (WACC): A specialized sheet for determining WACC based on user-defined inputs.
- Key Financial Ratios: Evaluate RCM Technologies, Inc.'s profitability, efficiency, and leverage.
- Customizable Inputs: Easily modify revenue growth, margins, and tax rates.
- Clear Dashboard: Visual representations and tables summarizing essential valuation outcomes.
Disclaimer
All information, articles, and product details provided on this website are for general informational and educational purposes only. We do not claim any ownership over, nor do we intend to infringe upon, any trademarks, copyrights, logos, brand names, or other intellectual property mentioned or depicted on this site. Such intellectual property remains the property of its respective owners, and any references here are made solely for identification or informational purposes, without implying any affiliation, endorsement, or partnership.
We make no representations or warranties, express or implied, regarding the accuracy, completeness, or suitability of any content or products presented. Nothing on this website should be construed as legal, tax, investment, financial, medical, or other professional advice. In addition, no part of this site—including articles or product references—constitutes a solicitation, recommendation, endorsement, advertisement, or offer to buy or sell any securities, franchises, or other financial instruments, particularly in jurisdictions where such activity would be unlawful.
All content is of a general nature and may not address the specific circumstances of any individual or entity. It is not a substitute for professional advice or services. Any actions you take based on the information provided here are strictly at your own risk. You accept full responsibility for any decisions or outcomes arising from your use of this website and agree to release us from any liability in connection with your use of, or reliance upon, the content or products found herein.