
|
Redhill Biopharma Ltd. (RDHL) DCF -Bewertung |
Fully Editable: Tailor To Your Needs In Excel Or Sheets
Professional Design: Trusted, Industry-Standard Templates
Investor-Approved Valuation Models
MAC/PC Compatible, Fully Unlocked
No Expertise Is Needed; Easy To Follow
RedHill Biopharma Ltd. (RDHL) Bundle
Gewinnen Sie mit unserem fortschrittlichen DCF -Taschenrechner Einblicke in Ihre Redhill Biopharma Ltd. (RDHL) -Schanganalyse! Mit realer RDHL -Daten können Sie diese Excel -Vorlage für die Anpassung von Prognosen und Annahmen ermöglichen, um den inneren Wert von Redhill Biopharma Ltd. (RDHL) genau zu bestimmen.
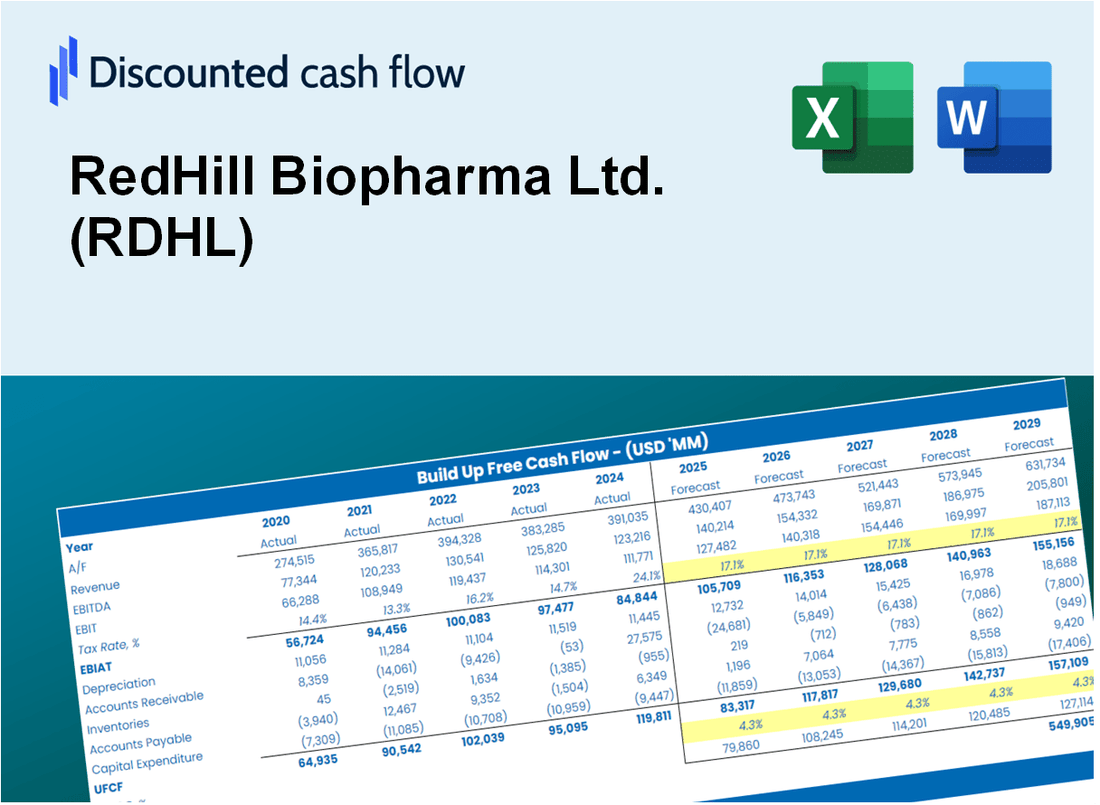
Discounted Cash Flow (DCF) - (USD MM)
| Year | AY1 2020 |
AY2 2021 |
AY3 2022 |
AY4 2023 |
AY5 2024 |
FY1 2025 |
FY2 2026 |
FY3 2027 |
FY4 2028 |
FY5 2029 |
|---|---|---|---|---|---|---|---|---|---|---|
| Revenue | 64.4 | 85.8 | 61.8 | 6.5 | 8.0 | 6.8 | 5.8 | 4.9 | 4.2 | 3.5 |
| Revenue Growth, % | 0 | 33.25 | -27.94 | -89.43 | 23.17 | -15.24 | -15.24 | -15.24 | -15.24 | -15.24 |
| EBITDA | -55.0 | -63.0 | -22.2 | 26.3 | -7.6 | -2.6 | -2.2 | -1.9 | -1.6 | -1.3 |
| EBITDA, % | -85.42 | -73.5 | -35.89 | 402.34 | -94.42 | -37.85 | -37.85 | -37.85 | -37.85 | -37.85 |
| Depreciation | 8.7 | 18.1 | 8.2 | 2.0 | .6 | 1.2 | 1.0 | .8 | .7 | .6 |
| Depreciation, % | 13.59 | 21.16 | 13.19 | 30.47 | 7.7 | 17.22 | 17.22 | 17.22 | 17.22 | 17.22 |
| EBIT | -63.7 | -81.2 | -30.3 | 24.3 | -8.2 | -3.3 | -2.8 | -2.4 | -2.0 | -1.7 |
| EBIT, % | -99.01 | -94.66 | -49.09 | 371.87 | -102.11 | -48.55 | -48.55 | -48.55 | -48.55 | -48.55 |
| Total Cash | 29.8 | 38.0 | 20.0 | 6.4 | 4.6 | 3.8 | 3.2 | 2.7 | 2.3 | 2.0 |
| Total Cash, percent | .0 | .0 | .0 | .0 | .0 | .0 | .0 | .0 | .0 | .0 |
| Account Receivables | 29.3 | 32.5 | 37.9 | 3.3 | 3.6 | 3.3 | 2.8 | 2.3 | 2.0 | 1.7 |
| Account Receivables, % | 45.51 | 37.93 | 61.29 | 50.31 | 44.34 | 47.87 | 47.87 | 47.87 | 47.87 | 47.87 |
| Inventories | 6.5 | 14.8 | 11.0 | 4.4 | 3.7 | 2.2 | 1.8 | 1.5 | 1.3 | 1.1 |
| Inventories, % | 10.14 | 17.27 | 17.81 | 67.21 | 45.39 | 31.57 | 31.57 | 31.57 | 31.57 | 31.57 |
| Accounts Payable | 11.6 | 11.7 | 4.2 | 3.3 | 7.9 | 2.5 | 2.2 | 1.8 | 1.5 | 1.3 |
| Accounts Payable, % | 17.95 | 13.6 | 6.84 | 50.2 | 97.74 | 37.27 | 37.27 | 37.27 | 37.27 | 37.27 |
| Capital Expenditure | -53.8 | -.1 | -.2 | .0 | .0 | -1.1 | -1.0 | -.8 | -.7 | -.6 |
| Capital Expenditure, % | -83.55 | -0.1341 | -0.32039 | -0.16845 | -0.1119 | -16.86 | -16.86 | -16.86 | -16.86 | -16.86 |
| Tax Rate, % | 0 | 0 | 0 | 0 | 0 | 0 | 0 | 0 | 0 | 0 |
| EBITAT | -63.7 | -81.2 | -30.3 | 24.3 | -8.2 | -3.3 | -2.8 | -2.4 | -2.0 | -1.7 |
| Depreciation | ||||||||||
| Changes in Account Receivables | ||||||||||
| Changes in Inventories | ||||||||||
| Changes in Accounts Payable | ||||||||||
| Capital Expenditure | ||||||||||
| UFCF | -133.0 | -74.6 | -31.4 | 66.5 | -2.6 | -6.8 | -2.3 | -2.0 | -1.7 | -1.4 |
| WACC, % | 15.46 | 15.46 | 15.46 | 15.46 | 15.46 | 15.46 | 15.46 | 15.46 | 15.46 | 15.46 |
| PV UFCF | ||||||||||
| SUM PV UFCF | -10.6 | |||||||||
| Long Term Growth Rate, % | 2.00 | |||||||||
| Free cash flow (T + 1) | -1 | |||||||||
| Terminal Value | -11 | |||||||||
| Present Terminal Value | -5 | |||||||||
| Enterprise Value | -16 | |||||||||
| Net Debt | -4 | |||||||||
| Equity Value | -12 | |||||||||
| Diluted Shares Outstanding, MM | 0 | |||||||||
| Equity Value Per Share | -47,188.06 |
What You Will Get
- Editable Forecast Inputs: Easily modify key assumptions (growth %, margins, WACC) to explore various scenarios.
- Real-World Data: RedHill Biopharma Ltd.’s (RDHL) financial data pre-filled to facilitate your analysis.
- Automatic DCF Outputs: The template computes Net Present Value (NPV) and intrinsic value automatically.
- Customizable and Professional: A refined Excel model that adjusts to your valuation requirements.
- Built for Analysts and Investors: Perfect for testing projections, validating strategies, and enhancing efficiency.
Key Features
- Comprehensive Pipeline Overview: Detailed insights into RedHill Biopharma's clinical and preclinical assets.
- Market Analysis Tools: In-depth market research and competitive landscape assessments tailored for RDHL.
- Customizable Financial Projections: Adjust revenue forecasts, R&D expenditures, and operational costs.
- Integrated Performance Metrics: Evaluate key performance indicators related to drug development and commercialization for RedHill Biopharma.
- User-Friendly Dashboard: Interactive visualizations that highlight essential performance and valuation indicators.
How It Works
- Download: Obtain the pre-prepared Excel file containing RedHill Biopharma Ltd.'s (RDHL) financial data.
- Customize: Modify projections, including revenue growth, EBITDA %, and WACC.
- Update Automatically: The intrinsic value and NPV calculations refresh in real-time.
- Test Scenarios: Develop various forecasts and immediately compare results.
- Make Decisions: Utilize the valuation findings to inform your investment approach.
Why Choose This Calculator for RedHill Biopharma Ltd. (RDHL)?
- Comprehensive Tool: Combines DCF, WACC, and financial ratio analyses specifically tailored for biopharmaceuticals.
- Customizable Inputs: Modify yellow-highlighted cells to explore different financial scenarios relevant to RDHL.
- Detailed Insights: Automatically computes RedHill's intrinsic value and Net Present Value for informed decision-making.
- Preloaded Data: Access to historical and projected data ensures reliable baseline analysis.
- Professional Quality: Perfect for financial analysts, investors, and consultants focused on the biotech sector.
Who Should Use This Product?
- Investors: Accurately assess RedHill Biopharma Ltd.'s (RDHL) fair value before making investment choices.
- CFOs: Utilize a sophisticated DCF model for financial reporting and analysis specific to RedHill Biopharma Ltd. (RDHL).
- Consultants: Efficiently modify the template for valuation reports tailored to RedHill Biopharma Ltd. (RDHL) clients.
- Entrepreneurs: Discover financial modeling techniques employed by leading biopharmaceutical companies like RedHill Biopharma Ltd. (RDHL).
- Educators: Implement it as a teaching resource to illustrate valuation methodologies relevant to the biopharma sector.
What the Template Contains
- Preloaded RDHL Data: Historical and projected financial data, including revenue, EBIT, and capital expenditures.
- DCF and WACC Models: Professional-grade sheets for calculating intrinsic value and Weighted Average Cost of Capital.
- Editable Inputs: Yellow-highlighted cells for adjusting revenue growth, tax rates, and discount rates.
- Financial Statements: Comprehensive annual and quarterly financials for deeper analysis.
- Key Ratios: Profitability, leverage, and efficiency ratios to evaluate performance.
- Dashboard and Charts: Visual summaries of valuation outcomes and assumptions.
Disclaimer
All information, articles, and product details provided on this website are for general informational and educational purposes only. We do not claim any ownership over, nor do we intend to infringe upon, any trademarks, copyrights, logos, brand names, or other intellectual property mentioned or depicted on this site. Such intellectual property remains the property of its respective owners, and any references here are made solely for identification or informational purposes, without implying any affiliation, endorsement, or partnership.
We make no representations or warranties, express or implied, regarding the accuracy, completeness, or suitability of any content or products presented. Nothing on this website should be construed as legal, tax, investment, financial, medical, or other professional advice. In addition, no part of this site—including articles or product references—constitutes a solicitation, recommendation, endorsement, advertisement, or offer to buy or sell any securities, franchises, or other financial instruments, particularly in jurisdictions where such activity would be unlawful.
All content is of a general nature and may not address the specific circumstances of any individual or entity. It is not a substitute for professional advice or services. Any actions you take based on the information provided here are strictly at your own risk. You accept full responsibility for any decisions or outcomes arising from your use of this website and agree to release us from any liability in connection with your use of, or reliance upon, the content or products found herein.