
|
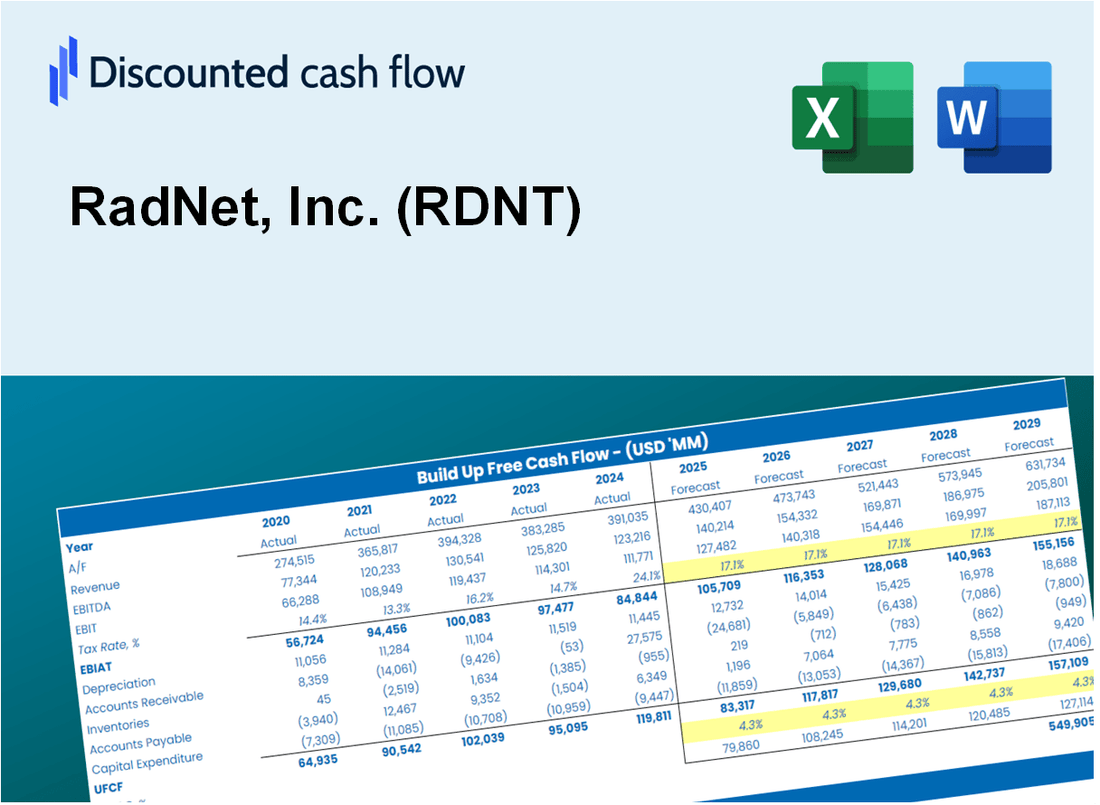
Radnet, Inc. (RDNT) DCF -Bewertung |
Fully Editable: Tailor To Your Needs In Excel Or Sheets
Professional Design: Trusted, Industry-Standard Templates
Investor-Approved Valuation Models
MAC/PC Compatible, Fully Unlocked
No Expertise Is Needed; Easy To Follow
RadNet, Inc. (RDNT) Bundle
Optimieren Sie Ihre Zeit und verbessern Sie die Präzision mit unserem [Symbol] DCF -Taschenrechner! Mit echten RadNet -Daten und anpassbaren Annahmen ermöglichen dieses Tool Sie, Radnet, Inc. (RDNT) zu prognostizieren, zu analysieren und zu value, als wären Sie ein professioneller Investor.
What You Will Get
- Editable Forecast Inputs: Easily modify assumptions (growth %, margins, WACC) to explore various scenarios.
- Real-World Data: RadNet, Inc.'s (RDNT) financial data pre-filled to enhance your analysis.
- Automatic DCF Outputs: The template computes Net Present Value (NPV) and intrinsic value automatically.
- Customizable and Professional: A refined Excel model tailored to meet your valuation requirements.
- Built for Analysts and Investors: Perfect for testing projections, validating strategies, and optimizing efficiency.
Key Features
- Comprehensive Historical Data: RadNet, Inc.'s (RDNT) past financial statements and pre-filled projections.
- Customizable Variables: Adjust WACC, tax rates, revenue growth, and EBITDA margins as needed.
- Real-Time Insights: Watch RadNet, Inc.'s (RDNT) intrinsic value update instantly.
- Intuitive Visual Representations: Dashboard charts illustrate valuation outcomes and essential metrics.
- Designed for Precision: A professional-grade tool tailored for analysts, investors, and finance professionals.
How It Works
- Download the Template: Gain immediate access to the Excel-based RDNT DCF Calculator.
- Input Your Assumptions: Modify the yellow-highlighted cells for growth rates, WACC, margins, and other variables.
- Instant Calculations: The model automatically recalculates RadNet’s intrinsic value.
- Test Scenarios: Experiment with various assumptions to assess potential valuation fluctuations.
- Analyze and Decide: Leverage the results to inform your investment or financial decisions.
Why Choose This Calculator for RadNet, Inc. (RDNT)?
- Accurate Data: Up-to-date RadNet financials provide dependable valuation outcomes.
- Customizable: Tailor essential parameters such as growth rates, WACC, and tax rates to fit your forecasts.
- Time-Saving: Ready-made calculations save you from starting from scratch.
- Professional-Grade Tool: Crafted for investors, analysts, and consultants in the healthcare sector.
- User-Friendly: Easy-to-navigate design and clear instructions ensure accessibility for all users.
Who Should Use RadNet, Inc. (RDNT)?
- Healthcare Investors: Make informed investment choices with advanced analytics tailored for the healthcare sector.
- Market Analysts: Streamline your analysis process with customizable models specific to RadNet's operations.
- Consultants: Easily modify resources for client discussions or strategic presentations regarding RadNet.
- Healthcare Enthusiasts: Enhance your knowledge of the radiology market through practical insights and case studies.
- Educators and Students: Utilize it as an effective educational resource in healthcare finance courses.
What the Template Contains
- Historical Data: Includes RadNet, Inc.'s (RDNT) past financials and baseline forecasts.
- DCF and Levered DCF Models: Detailed templates to calculate RadNet, Inc.'s (RDNT) intrinsic value.
- WACC Sheet: Pre-built calculations for Weighted Average Cost of Capital.
- Editable Inputs: Modify key drivers like growth rates, EBITDA %, and CAPEX assumptions.
- Quarterly and Annual Statements: A complete breakdown of RadNet, Inc.'s (RDNT) financials.
- Interactive Dashboard: Visualize valuation results and projections dynamically.
Disclaimer
All information, articles, and product details provided on this website are for general informational and educational purposes only. We do not claim any ownership over, nor do we intend to infringe upon, any trademarks, copyrights, logos, brand names, or other intellectual property mentioned or depicted on this site. Such intellectual property remains the property of its respective owners, and any references here are made solely for identification or informational purposes, without implying any affiliation, endorsement, or partnership.
We make no representations or warranties, express or implied, regarding the accuracy, completeness, or suitability of any content or products presented. Nothing on this website should be construed as legal, tax, investment, financial, medical, or other professional advice. In addition, no part of this site—including articles or product references—constitutes a solicitation, recommendation, endorsement, advertisement, or offer to buy or sell any securities, franchises, or other financial instruments, particularly in jurisdictions where such activity would be unlawful.
All content is of a general nature and may not address the specific circumstances of any individual or entity. It is not a substitute for professional advice or services. Any actions you take based on the information provided here are strictly at your own risk. You accept full responsibility for any decisions or outcomes arising from your use of this website and agree to release us from any liability in connection with your use of, or reliance upon, the content or products found herein.