
|
Radware Ltd. (RDWR) DCF -Bewertung |
Fully Editable: Tailor To Your Needs In Excel Or Sheets
Professional Design: Trusted, Industry-Standard Templates
Investor-Approved Valuation Models
MAC/PC Compatible, Fully Unlocked
No Expertise Is Needed; Easy To Follow
Radware Ltd. (RDWR) Bundle
Unabhängig davon, ob Sie ein Investor oder Analyst sind, ist dieser (RDWR) DCF -Taschenrechner Ihr wesentliches Werkzeug für eine genaue Bewertung. Mit Radware Ltd. Real Data können Sie Prognosen anpassen und die Auswirkungen sofort beobachten.
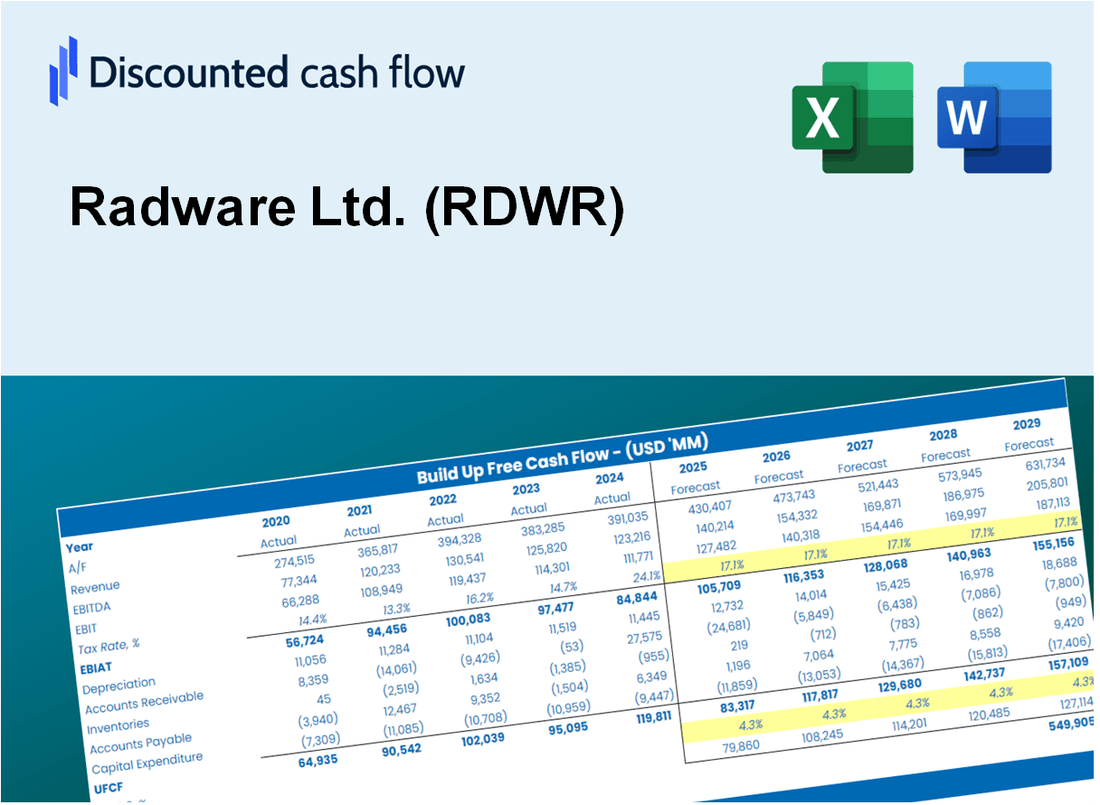
Discounted Cash Flow (DCF) - (USD MM)
| Year | AY1 2020 |
AY2 2021 |
AY3 2022 |
AY4 2023 |
AY5 2024 |
FY1 2025 |
FY2 2026 |
FY3 2027 |
FY4 2028 |
FY5 2029 |
|---|---|---|---|---|---|---|---|---|---|---|
| Revenue | 250.0 | 286.5 | 293.4 | 261.3 | 274.9 | 282.6 | 290.6 | 298.7 | 307.1 | 315.8 |
| Revenue Growth, % | 0 | 14.59 | 2.42 | -10.95 | 5.2 | 2.81 | 2.81 | 2.81 | 2.81 | 2.81 |
| EBITDA | 16.7 | 28.4 | 8.4 | -19.4 | 7.9 | 8.4 | 8.7 | 8.9 | 9.2 | 9.4 |
| EBITDA, % | 6.69 | 9.92 | 2.85 | -7.44 | 2.89 | 2.98 | 2.98 | 2.98 | 2.98 | 2.98 |
| Depreciation | 10.6 | 10.2 | 11.7 | 12.2 | 11.8 | 11.7 | 12.1 | 12.4 | 12.8 | 13.1 |
| Depreciation, % | 4.22 | 3.56 | 3.98 | 4.69 | 4.31 | 4.15 | 4.15 | 4.15 | 4.15 | 4.15 |
| EBIT | 6.2 | 18.2 | -3.3 | -31.7 | -3.9 | -3.3 | -3.4 | -3.5 | -3.6 | -3.7 |
| EBIT, % | 2.47 | 6.36 | -1.14 | -12.12 | -1.41 | -1.17 | -1.17 | -1.17 | -1.17 | -1.17 |
| Total Cash | 310.5 | 287.9 | 298.0 | 330.6 | 275.8 | 282.6 | 290.6 | 298.7 | 307.1 | 315.8 |
| Total Cash, percent | .0 | .0 | .0 | .0 | .0 | .0 | .0 | .0 | .0 | .0 |
| Account Receivables | 16.8 | 13.2 | 17.8 | 20.3 | 16.8 | 17.7 | 18.2 | 18.7 | 19.2 | 19.7 |
| Account Receivables, % | 6.74 | 4.6 | 6.05 | 7.76 | 6.12 | 6.25 | 6.25 | 6.25 | 6.25 | 6.25 |
| Inventories | 13.9 | 11.6 | 11.4 | 15.5 | 14.0 | 13.9 | 14.3 | 14.7 | 15.1 | 15.5 |
| Inventories, % | 5.57 | 4.04 | 3.89 | 5.95 | 5.1 | 4.91 | 4.91 | 4.91 | 4.91 | 4.91 |
| Accounts Payable | 3.9 | 4.3 | 6.5 | 4.3 | 5.6 | 5.1 | 5.2 | 5.3 | 5.5 | 5.6 |
| Accounts Payable, % | 1.55 | 1.5 | 2.2 | 1.64 | 2.03 | 1.79 | 1.79 | 1.79 | 1.79 | 1.79 |
| Capital Expenditure | -8.7 | -5.6 | -8.8 | -5.4 | -5.3 | -7.0 | -7.2 | -7.4 | -7.6 | -7.8 |
| Capital Expenditure, % | -3.47 | -1.96 | -3 | -2.08 | -1.92 | -2.49 | -2.49 | -2.49 | -2.49 | -2.49 |
| Tax Rate, % | 52.33 | 52.33 | 52.33 | 52.33 | 52.33 | 52.33 | 52.33 | 52.33 | 52.33 | 52.33 |
| EBITAT | 4.3 | 6.3 | .1 | -38.5 | -1.9 | -1.7 | -1.7 | -1.8 | -1.8 | -1.9 |
| Depreciation | ||||||||||
| Changes in Account Receivables | ||||||||||
| Changes in Inventories | ||||||||||
| Changes in Accounts Payable | ||||||||||
| Capital Expenditure | ||||||||||
| UFCF | -20.8 | 17.3 | .7 | -40.5 | 10.9 | 1.8 | 2.4 | 2.5 | 2.5 | 2.6 |
| WACC, % | 8.17 | 8.14 | 8.12 | 8.19 | 8.15 | 8.15 | 8.15 | 8.15 | 8.15 | 8.15 |
| PV UFCF | ||||||||||
| SUM PV UFCF | 9.3 | |||||||||
| Long Term Growth Rate, % | 4.00 | |||||||||
| Free cash flow (T + 1) | 3 | |||||||||
| Terminal Value | 65 | |||||||||
| Present Terminal Value | 44 | |||||||||
| Enterprise Value | 53 | |||||||||
| Net Debt | -80 | |||||||||
| Equity Value | 134 | |||||||||
| Diluted Shares Outstanding, MM | 43 | |||||||||
| Equity Value Per Share | 3.08 |
What You Will Get
- Real Radware Data: Preloaded financials – from revenue to EBIT – based on actual and projected figures.
- Full Customization: Adjust all critical parameters (yellow cells) like WACC, growth %, and tax rates.
- Instant Valuation Updates: Automatic recalculations to analyze the impact of changes on Radware’s fair value.
- Versatile Excel Template: Tailored for quick edits, scenario testing, and detailed projections.
- Time-Saving and Accurate: Skip building models from scratch while maintaining precision and flexibility.
Key Features
- Customizable Performance Metrics: Adjust essential inputs such as network traffic, application performance, and security parameters.
- Instant Traffic Analysis: Provides real-time insights into application performance and security threats.
- Enterprise-Level Precision: Leverages Radware’s industry expertise for accurate performance metrics.
- Comprehensive Scenario Testing: Easily evaluate various strategies and analyze their impacts.
- Efficiency Booster: Streamlines the process of monitoring and optimizing application delivery.
How It Works
- Download the Template: Gain immediate access to the Excel-based RDWR DCF Calculator.
- Input Your Assumptions: Modify the yellow-highlighted cells for growth rates, WACC, margins, and more.
- Instant Calculations: The model automatically recalculates Radware's intrinsic value.
- Test Scenarios: Experiment with different assumptions to assess potential valuation variations.
- Analyze and Decide: Utilize the results to inform your investment or financial analysis.
Why Choose This Calculator for Radware Ltd. (RDWR)?
- Designed for Experts: A sophisticated tool utilized by IT analysts, financial officers, and tech consultants.
- Accurate Data: Radware’s historical and forecasted financials integrated for precision.
- Flexible Scenario Analysis: Effortlessly model various projections and assumptions.
- Insightful Outputs: Automatically computes intrinsic value, NPV, and essential metrics.
- User-Friendly: Comprehensive step-by-step guidance to facilitate your calculations.
Who Should Use This Product?
- Investors: Accurately assess Radware Ltd.’s (RDWR) fair value prior to making investment choices.
- CFOs: Utilize a professional-grade DCF model for comprehensive financial reporting and analysis.
- Consultants: Efficiently customize the template for valuation reports tailored to clients.
- Entrepreneurs: Acquire insights into financial modeling techniques employed by leading tech firms.
- Educators: Implement it as a teaching resource to illustrate various valuation methodologies.
What the Template Contains
- Pre-Filled Data: Contains Radware Ltd.'s historical financials and projections.
- Discounted Cash Flow Model: Interactive DCF valuation model with real-time calculations.
- Weighted Average Cost of Capital (WACC): A specific sheet for computing WACC using tailored inputs.
- Key Financial Ratios: Evaluate Radware Ltd.'s profitability, operational efficiency, and financial leverage.
- Customizable Inputs: Easily modify revenue growth rates, profit margins, and tax assumptions.
- Clear Dashboard: Visuals and tables that present essential valuation outcomes.
Disclaimer
All information, articles, and product details provided on this website are for general informational and educational purposes only. We do not claim any ownership over, nor do we intend to infringe upon, any trademarks, copyrights, logos, brand names, or other intellectual property mentioned or depicted on this site. Such intellectual property remains the property of its respective owners, and any references here are made solely for identification or informational purposes, without implying any affiliation, endorsement, or partnership.
We make no representations or warranties, express or implied, regarding the accuracy, completeness, or suitability of any content or products presented. Nothing on this website should be construed as legal, tax, investment, financial, medical, or other professional advice. In addition, no part of this site—including articles or product references—constitutes a solicitation, recommendation, endorsement, advertisement, or offer to buy or sell any securities, franchises, or other financial instruments, particularly in jurisdictions where such activity would be unlawful.
All content is of a general nature and may not address the specific circumstances of any individual or entity. It is not a substitute for professional advice or services. Any actions you take based on the information provided here are strictly at your own risk. You accept full responsibility for any decisions or outcomes arising from your use of this website and agree to release us from any liability in connection with your use of, or reliance upon, the content or products found herein.