
|
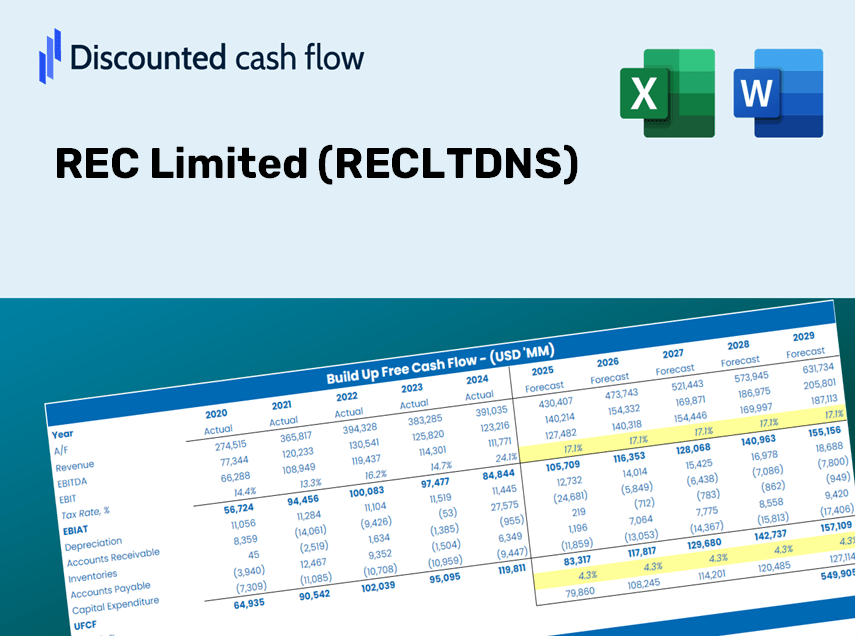
REC Limited (red.ns) DCF -Bewertung |
Fully Editable: Tailor To Your Needs In Excel Or Sheets
Professional Design: Trusted, Industry-Standard Templates
Investor-Approved Valuation Models
MAC/PC Compatible, Fully Unlocked
No Expertise Is Needed; Easy To Follow
REC Limited (RECLTD.NS) Bundle
Vereinfachen Sie die Bewertung von Rec Limited (REMLTDNS) mit diesem anpassbaren DCF -Taschenrechner! Mit Real Rec Limited (Recltdns) -Fonds und einstellbaren Prognoseeingaben können Sie Szenarien testen und Rec Limited (REMLTDNS) in nur Minuten aufdecken.
Discounted Cash Flow (DCF) - (USD MM)
| Year | AY1 2021 |
AY2 2022 |
AY3 2023 |
AY4 2024 |
AY5 2025 |
FY1 2026 |
FY2 2027 |
FY3 2028 |
FY4 2029 |
FY5 2030 |
|---|---|---|---|---|---|---|---|---|---|---|
| Revenue | 351,456.8 | 384,186.6 | 386,915.1 | 466,876.4 | 559,113.6 | 629,625.4 | 709,029.7 | 798,447.9 | 899,143.0 | 1,012,537.1 |
| Revenue Growth, % | 0 | 9.31 | 0.7102 | 20.67 | 19.76 | 12.61 | 12.61 | 12.61 | 12.61 | 12.61 |
| EBITDA | 316,130.7 | 334,454.6 | 360,797.6 | 179,839.3 | 201,421.7 | 434,187.9 | 488,944.9 | 550,607.4 | 620,046.5 | 698,242.7 |
| EBITDA, % | 89.95 | 87.06 | 93.25 | 38.52 | 36.03 | 68.96 | 68.96 | 68.96 | 68.96 | 68.96 |
| Depreciation | 108.6 | 182.4 | 242.6 | 239.9 | 247.0 | 298.0 | 335.6 | 377.9 | 425.5 | 479.2 |
| Depreciation, % | 0.03089996 | 0.04747693 | 0.06270109 | 0.05138405 | 0.04417707 | 0.04732782 | 0.04732782 | 0.04732782 | 0.04732782 | 0.04732782 |
| EBIT | 316,022.1 | 334,272.2 | 360,555.0 | 179,599.4 | 201,174.7 | 433,889.9 | 488,609.3 | 550,229.5 | 619,620.9 | 697,763.5 |
| EBIT, % | 89.92 | 87.01 | 93.19 | 38.47 | 35.98 | 68.91 | 68.91 | 68.91 | 68.91 | 68.91 |
| Total Cash | 12,855.6 | 1,409.9 | 487.0 | 4,980.6 | 6,317.3 | 7,992.9 | 9,000.9 | 10,136.0 | 11,414.3 | 12,853.8 |
| Total Cash, percent | .0 | .0 | .0 | .0 | .0 | .0 | .0 | .0 | .0 | .0 |
| Account Receivables | 245,181.5 | 244,659.7 | 244,854.3 | 245,382.9 | 247,569.0 | 369,672.0 | 416,292.6 | 468,792.7 | 527,913.8 | 594,490.9 |
| Account Receivables, % | 69.76 | 63.68 | 63.28 | 52.56 | 44.28 | 58.71 | 58.71 | 58.71 | 58.71 | 58.71 |
| Inventories | .0 | 1,832.1 | 244,661.8 | .0 | .0 | 80,227.9 | 90,345.8 | 101,739.6 | 114,570.3 | 129,019.2 |
| Inventories, % | 0 | 0.47688 | 63.23 | 0 | 0 | 12.74 | 12.74 | 12.74 | 12.74 | 12.74 |
| Accounts Payable | 618.5 | 364.8 | 416.8 | 905.1 | 1,338.7 | 1,022.5 | 1,151.4 | 1,296.6 | 1,460.1 | 1,644.3 |
| Accounts Payable, % | 0.17598 | 0.09495386 | 0.10772 | 0.19386 | 0.23943 | 0.16239 | 0.16239 | 0.16239 | 0.16239 | 0.16239 |
| Capital Expenditure | -742.5 | -481.5 | -176.8 | -336.3 | -828.8 | -758.8 | -854.5 | -962.2 | -1,083.6 | -1,220.2 |
| Capital Expenditure, % | -0.21126 | -0.12533 | -0.04569478 | -0.07203191 | -0.14823 | -0.12051 | -0.12051 | -0.12051 | -0.12051 | -0.12051 |
| Tax Rate, % | 21.04 | 21.04 | 21.04 | 21.04 | 21.04 | 21.04 | 21.04 | 21.04 | 21.04 | 21.04 |
| EBITAT | 245,622.4 | 269,872.3 | 289,711.2 | 141,454.6 | 158,842.3 | 344,098.6 | 387,494.0 | 436,362.3 | 491,393.5 | 553,364.8 |
| Depreciation | ||||||||||
| Changes in Account Receivables | ||||||||||
| Changes in Inventories | ||||||||||
| Changes in Accounts Payable | ||||||||||
| Capital Expenditure | ||||||||||
| UFCF | 425.5 | 268,009.2 | 46,804.7 | 385,979.7 | 156,508.0 | 140,990.6 | 330,365.6 | 372,029.2 | 418,947.1 | 471,782.0 |
| WACC, % | 5.31 | 5.48 | 5.46 | 5.37 | 5.38 | 5.4 | 5.4 | 5.4 | 5.4 | 5.4 |
| PV UFCF | ||||||||||
| SUM PV UFCF | 1,451,138.0 | |||||||||
| Long Term Growth Rate, % | 2.00 | |||||||||
| Free cash flow (T + 1) | 481,218 | |||||||||
| Terminal Value | 14,162,787 | |||||||||
| Present Terminal Value | 10,889,095 | |||||||||
| Enterprise Value | 12,340,233 | |||||||||
| Net Debt | 4,956,109 | |||||||||
| Equity Value | 7,384,124 | |||||||||
| Diluted Shares Outstanding, MM | 2,639 | |||||||||
| Equity Value Per Share | 2,798.53 |
What You Will Receive
- Authentic REC Limited Financials: Features historical and projected data for precise valuation.
- Customizable Inputs: Adjust WACC, tax rates, revenue growth, and capital investments as needed.
- Automatic Calculations: Intrinsic value and NPV are computed in real-time.
- Scenario Analysis: Explore various scenarios to assess REC Limited’s future performance.
- User-Friendly Design: Designed for professionals while still being approachable for newcomers.
Key Features
- Real-Life REC Limited Data: Pre-loaded with REC Limited’s historical financial performance and future estimates.
- Fully Customizable Inputs: Modify revenue growth rates, profit margins, WACC, tax percentages, and capital expenditures as needed.
- Dynamic Valuation Model: Instant updates to Net Present Value (NPV) and intrinsic value whenever you adjust your inputs.
- Scenario Testing: Develop various forecasting scenarios to explore different valuation possibilities.
- User-Friendly Design: Intuitive layout designed for both industry professionals and newcomers.
How It Operates
- Download the Template: Gain immediate access to the Excel-based REC Limited (RECLTDNS) DCF Calculator.
- Input Your Assumptions: Modify the yellow-highlighted cells for growth rates, WACC, margins, and additional variables.
- Instant Calculations: The model will automatically recalculate REC Limited’s intrinsic value.
- Test Scenarios: Experiment with various assumptions to assess potential changes in valuation.
- Analyze and Decide: Leverage the results to inform your investment or financial analysis decisions.
Why Choose the REC Limited (RECLTDNS) Calculator?
- Save Time: Skip the hassle of building a DCF model from scratch – it’s ready for immediate use.
- Enhance Accuracy: Dependable financial data and formulas minimize valuation errors.
- Fully Customizable: Adjust the model to align with your specific assumptions and forecasts.
- Easy to Understand: Intuitive charts and outputs simplify the analysis of results.
- Preferred by Professionals: Crafted for experts who prioritize precision and user-friendliness.
Who Should Use REC Limited (RECLTDNS)?
- Individual Investors: Make well-informed choices regarding the purchase or sale of REC Limited (RECLTDNS) stock.
- Financial Analysts: Enhance valuation workflows with pre-built financial models tailored for REC Limited (RECLTDNS).
- Consultants: Provide clients with timely and precise valuation insights related to REC Limited (RECLTDNS).
- Business Owners: Gain insights into how major companies like REC Limited (RECLTDNS) are valued to inform your own business strategies.
- Finance Students: Explore valuation methods using real data and case studies focused on REC Limited (RECLTDNS).
Contents of the Template
- Preloaded REC Limited Data: Historical and projected financial information, including revenue, EBIT, and capital expenditures.
- DCF and WACC Models: Advanced sheets designed for calculating intrinsic value and the Weighted Average Cost of Capital.
- Editable Inputs: Yellow-highlighted cells for modifying revenue growth, tax rates, and discount rates.
- Financial Statements: Detailed annual and quarterly financial statements for in-depth analysis.
- Key Ratios: Metrics for profitability, leverage, and efficiency to assess performance.
- Dashboard and Charts: Visual representations of valuation results and underlying assumptions.
Disclaimer
All information, articles, and product details provided on this website are for general informational and educational purposes only. We do not claim any ownership over, nor do we intend to infringe upon, any trademarks, copyrights, logos, brand names, or other intellectual property mentioned or depicted on this site. Such intellectual property remains the property of its respective owners, and any references here are made solely for identification or informational purposes, without implying any affiliation, endorsement, or partnership.
We make no representations or warranties, express or implied, regarding the accuracy, completeness, or suitability of any content or products presented. Nothing on this website should be construed as legal, tax, investment, financial, medical, or other professional advice. In addition, no part of this site—including articles or product references—constitutes a solicitation, recommendation, endorsement, advertisement, or offer to buy or sell any securities, franchises, or other financial instruments, particularly in jurisdictions where such activity would be unlawful.
All content is of a general nature and may not address the specific circumstances of any individual or entity. It is not a substitute for professional advice or services. Any actions you take based on the information provided here are strictly at your own risk. You accept full responsibility for any decisions or outcomes arising from your use of this website and agree to release us from any liability in connection with your use of, or reliance upon, the content or products found herein.