
|
Rekor Systems, Inc. (REKR) DCF -Bewertung |
Fully Editable: Tailor To Your Needs In Excel Or Sheets
Professional Design: Trusted, Industry-Standard Templates
Investor-Approved Valuation Models
MAC/PC Compatible, Fully Unlocked
No Expertise Is Needed; Easy To Follow
Rekor Systems, Inc. (REKR) Bundle
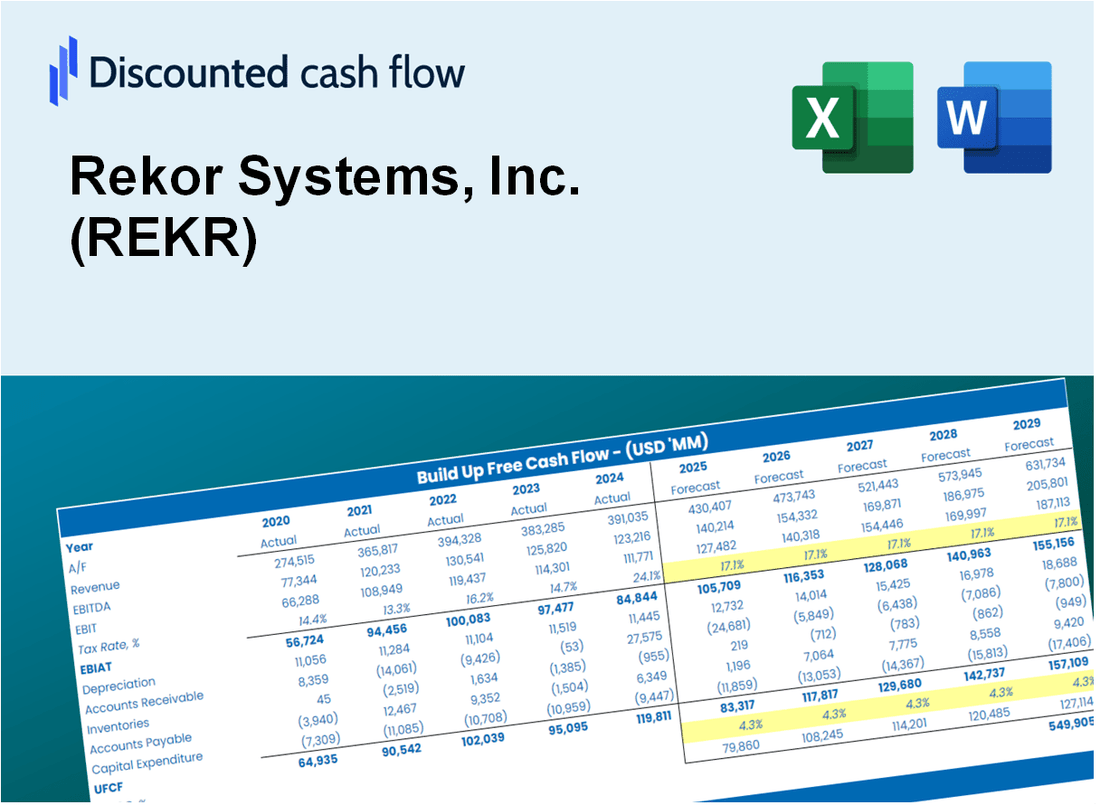
Rekor Systems, Inc. (REKR) finanzielle Aussichten mit unserem benutzerfreundlichen DCF-Taschenrechner! Geben Sie Ihre Prognosen für Wachstum, Margen und Ausgaben ein, um Rekor Systems, Inc. (REKR) intrinsischer Wert zu ermitteln und Ihren Investitionsansatz zu verbessern.
What You Will Get
- Authentic Rekor Data: Preloaded financials – from revenue to EBIT – based on actual and projected figures for Rekor Systems, Inc. (REKR).
- Complete Customization: Modify all essential parameters (yellow cells) such as WACC, growth %, and tax rates to fit your analysis.
- Immediate Valuation Updates: Automatic recalculations to assess the effects of changes on Rekor's fair value.
- Flexible Excel Template: Designed for quick modifications, scenario analysis, and comprehensive projections.
- Efficient and Precise: Avoid the hassle of building models from the ground up while ensuring accuracy and adaptability.
Key Features
- Comprehensive REKR Data: Pre-populated with Rekor Systems' historical performance metrics and future projections.
- Customizable Assumptions: Modify parameters such as revenue growth rates, profit margins, discount rates, tax implications, and investment expenditures.
- Interactive Valuation Framework: Automatically recalculates Net Present Value (NPV) and intrinsic value based on your customized inputs.
- Scenario Analysis: Develop various forecasting scenarios to evaluate different valuation possibilities.
- Intuitive Interface: Designed for ease of use, catering to both industry experts and newcomers.
How It Works
- 1. Access the Template: Download and open the Excel file containing Rekor Systems, Inc. (REKR) preloaded data.
- 2. Adjust Key Inputs: Modify essential parameters such as growth projections, WACC, and capital investments.
- 3. Instant Results: The DCF model automatically computes intrinsic value and NPV based on your adjustments.
- 4. Explore Scenarios: Analyze various forecasts to evaluate different valuation possibilities.
- 5. Make Informed Decisions: Present professional valuation findings to support your strategic choices.
Why Choose Rekor Systems, Inc. (REKR)?
- Time Efficient: Skip the hassle of building a model from the ground up – our solutions are ready to implement.
- Enhanced Precision: Access to dependable data and methodologies minimizes valuation inaccuracies.
- Completely Adaptable: Modify the framework to align with your specific assumptions and forecasts.
- User-Friendly: Intuitive visuals and outputs simplify the analysis of results.
- Endorsed by Professionals: Crafted for industry experts who prioritize accuracy and functionality.
Who Should Use Rekor Systems, Inc. (REKR)?
- Professional Investors: Develop comprehensive valuation models for informed investment decisions.
- Corporate Finance Teams: Evaluate valuation scenarios to support strategic planning and decision-making.
- Consultants and Advisors: Deliver precise valuation insights for clients interested in Rekor Systems, Inc. (REKR).
- Students and Educators: Utilize real-time data to enhance learning and practice in financial modeling.
- Tech Enthusiasts: Gain insights into the valuation processes of technology companies like Rekor Systems, Inc. (REKR).
What the Template Contains
- Comprehensive DCF Model: Editable template featuring detailed valuation calculations for Rekor Systems, Inc. (REKR).
- Real-World Data: Rekor's historical and projected financials preloaded for thorough analysis.
- Customizable Parameters: Modify WACC, growth rates, and tax assumptions to explore various scenarios.
- Financial Statements: Complete annual and quarterly breakdowns for enhanced insights.
- Key Ratios: Integrated analysis for profitability, efficiency, and leverage metrics.
- Dashboard with Visual Outputs: Charts and tables designed for clear, actionable insights.
Disclaimer
All information, articles, and product details provided on this website are for general informational and educational purposes only. We do not claim any ownership over, nor do we intend to infringe upon, any trademarks, copyrights, logos, brand names, or other intellectual property mentioned or depicted on this site. Such intellectual property remains the property of its respective owners, and any references here are made solely for identification or informational purposes, without implying any affiliation, endorsement, or partnership.
We make no representations or warranties, express or implied, regarding the accuracy, completeness, or suitability of any content or products presented. Nothing on this website should be construed as legal, tax, investment, financial, medical, or other professional advice. In addition, no part of this site—including articles or product references—constitutes a solicitation, recommendation, endorsement, advertisement, or offer to buy or sell any securities, franchises, or other financial instruments, particularly in jurisdictions where such activity would be unlawful.
All content is of a general nature and may not address the specific circumstances of any individual or entity. It is not a substitute for professional advice or services. Any actions you take based on the information provided here are strictly at your own risk. You accept full responsibility for any decisions or outcomes arising from your use of this website and agree to release us from any liability in connection with your use of, or reliance upon, the content or products found herein.