
|
Reliance Industries Limited (Reliance.NS) DCF -Bewertung |
Fully Editable: Tailor To Your Needs In Excel Or Sheets
Professional Design: Trusted, Industry-Standard Templates
Investor-Approved Valuation Models
MAC/PC Compatible, Fully Unlocked
No Expertise Is Needed; Easy To Follow
Reliance Industries Limited (RELIANCE.NS) Bundle
Verbessern Sie Ihre Anlagestrategie mit dem (Reliancens) DCF -Taschenrechner! Nutzen Sie die tatsächlichen Reliance Industries Limited Finanzdaten, passen Sie Wachstumsprojektionen und -kosten an und beobachten Sie sofort, wie sich diese Modifikationen auf den inneren Wert von (Reliancens) auswirken.
Benefits You Will Receive
- Authentic RELIANCENS Financial Data: Pre-populated with historical and projected data for accurate analysis.
- Customizable Template: Effortlessly adjust key metrics such as revenue growth, WACC, and EBITDA percentage.
- Instant Calculations: Observe real-time updates of Reliance Industries' intrinsic value as you make adjustments.
- Expert Valuation Tool: Tailored for investors, analysts, and consultants aiming for precise DCF assessments.
- Intuitive Design: An easy-to-navigate layout with clear instructions suitable for all skill levels.
Key Features
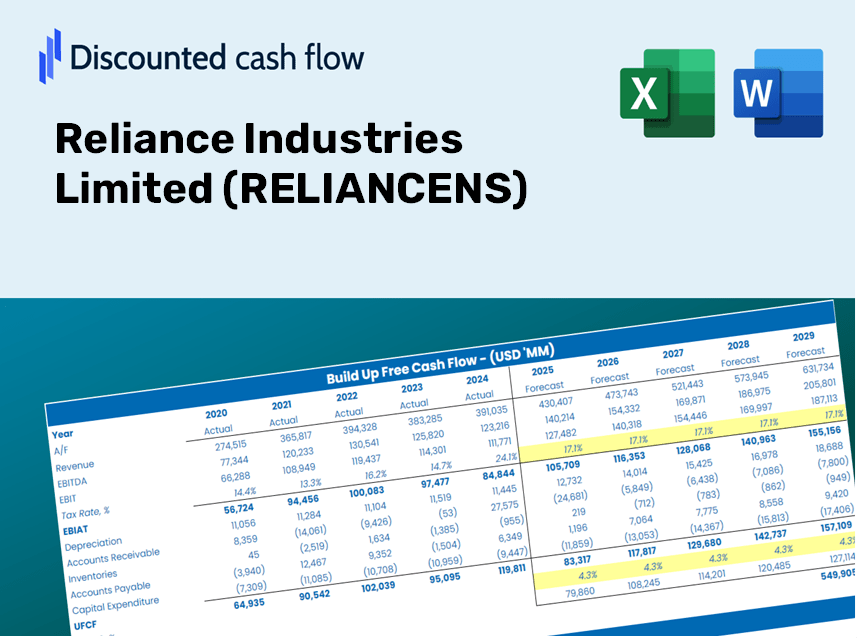
- Authentic Reliance Financials: Gain access to precise pre-loaded historical data and forecasts for Reliance Industries Limited (RELIANCENS).
- Adjustable Forecast Parameters: Modify the highlighted fields such as WACC, growth rates, and profit margins to suit your analysis.
- Real-Time Calculations: Automatic updates for DCF, Net Present Value (NPV), and cash flow assessments.
- User-Friendly Dashboard: Clear charts and summaries for a comprehensive view of your valuation outcomes.
- Designed for All Skill Levels: An intuitive layout catering to investors, CFOs, and consultants alike.
How It Works
- 1. Access the Template: Download and open the Excel file containing Reliance Industries Limited's preloaded data.
- 2. Update Assumptions: Modify key inputs such as growth rates, WACC, and capital expenditures specific to (RELIANCENS).
- 3. Instant Results: The DCF model automatically computes the intrinsic value and NPV based on your adjustments.
- 4. Explore Scenarios: Evaluate different forecasts to understand various valuation outcomes for (RELIANCENS).
- 5. Make Informed Decisions: Use the professional valuation insights to confidently support your investment choices.
Why Opt for Reliance Industries Limited (RELIANCENS)?
- Save Time: Skip the hassle of building a model from scratch – it’s all set for you.
- Enhance Accuracy: Dependable financial information and formulas minimize valuation errors.
- Completely Customizable: Adjust the model to align with your specific assumptions and forecasts.
- Simple to Analyze: Intuitive charts and outputs simplify result interpretation.
- Endorsed by Professionals: Crafted for experts who prioritize both precision and ease of use.
Who Can Benefit from This Product?
- Finance Students: Master valuation techniques and apply them to real-world data.
- Academics: Integrate professional valuation models into your teaching or research studies.
- Investors: Challenge your assumptions and evaluate valuation projections for Reliance Industries Limited (RELIANCENS).
- Analysts: Enhance your efficiency with a customizable DCF model tailored for your needs.
- Small Business Owners: Understand the analytical approaches used for large corporations like Reliance Industries Limited (RELIANCENS).
Contents of the Template
- Pre-Filled DCF Model: Reliance Industries Limited (RELIANCENS) financial data preloaded for immediate use.
- WACC Calculator: Comprehensive calculations for Weighted Average Cost of Capital.
- Financial Ratios: Assess Reliance's profitability, leverage, and operational efficiency.
- Editable Inputs: Modify assumptions such as growth rates, margins, and CAPEX to suit your analysis.
- Financial Statements: Access annual and quarterly reports for in-depth evaluation.
- Interactive Dashboard: Visualize key valuation metrics and outcomes with ease.
Disclaimer
All information, articles, and product details provided on this website are for general informational and educational purposes only. We do not claim any ownership over, nor do we intend to infringe upon, any trademarks, copyrights, logos, brand names, or other intellectual property mentioned or depicted on this site. Such intellectual property remains the property of its respective owners, and any references here are made solely for identification or informational purposes, without implying any affiliation, endorsement, or partnership.
We make no representations or warranties, express or implied, regarding the accuracy, completeness, or suitability of any content or products presented. Nothing on this website should be construed as legal, tax, investment, financial, medical, or other professional advice. In addition, no part of this site—including articles or product references—constitutes a solicitation, recommendation, endorsement, advertisement, or offer to buy or sell any securities, franchises, or other financial instruments, particularly in jurisdictions where such activity would be unlawful.
All content is of a general nature and may not address the specific circumstances of any individual or entity. It is not a substitute for professional advice or services. Any actions you take based on the information provided here are strictly at your own risk. You accept full responsibility for any decisions or outcomes arising from your use of this website and agree to release us from any liability in connection with your use of, or reliance upon, the content or products found herein.