
|
Mieten Sie die DCF -Bewertung der Runway, Inc. (Rent) |
Fully Editable: Tailor To Your Needs In Excel Or Sheets
Professional Design: Trusted, Industry-Standard Templates
Investor-Approved Valuation Models
MAC/PC Compatible, Fully Unlocked
No Expertise Is Needed; Easy To Follow
Rent the Runway, Inc. (RENT) Bundle
Sparen Sie Zeit und verbessern Sie die Präzision mit unserem (Miete) DCF -Taschenrechner! In diesem Tool können Sie mit echtem Runway -Daten und anpassbaren Annahmen die Runway, Inc. wie einen erfahrenen Investor prognostizieren, analysieren und schätzen.
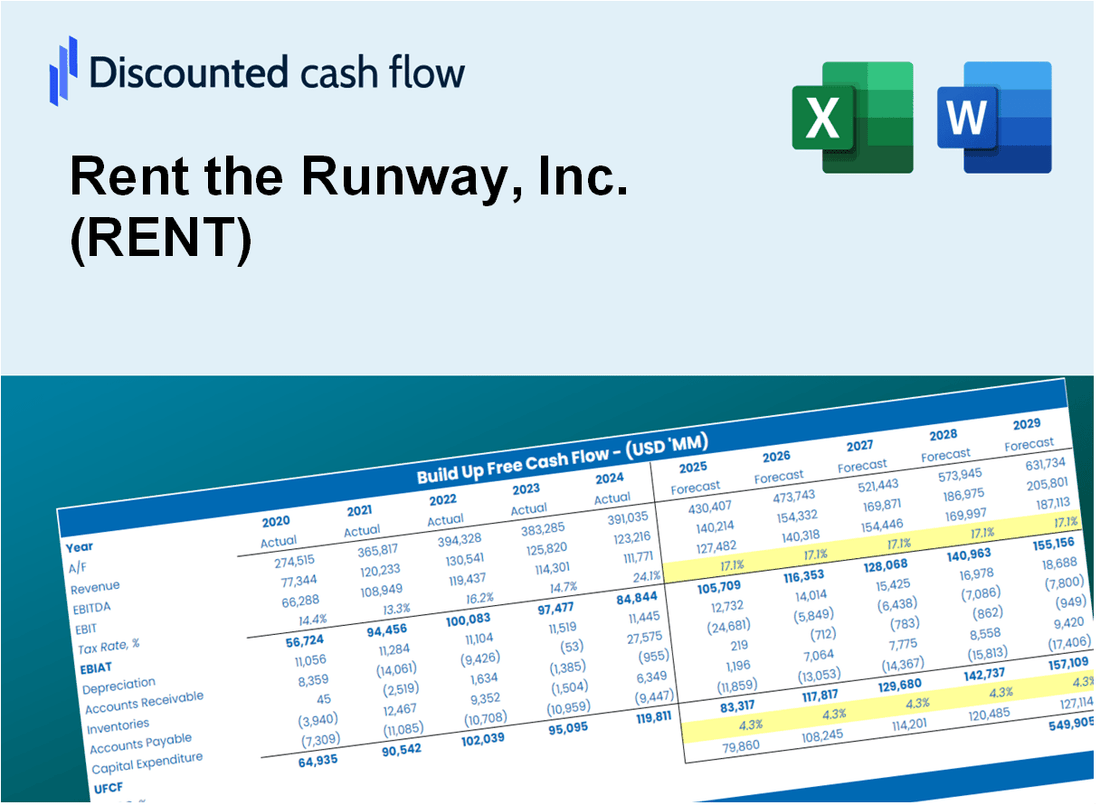
Discounted Cash Flow (DCF) - (USD MM)
| Year | AY1 2020 |
AY2 2021 |
AY3 2022 |
AY4 2023 |
AY5 2024 |
FY1 2025 |
FY2 2026 |
FY3 2027 |
FY4 2028 |
FY5 2029 |
|---|---|---|---|---|---|---|---|---|---|---|
| Revenue | 157.5 | 203.3 | 296.4 | 298.2 | 306.2 | 366.0 | 437.6 | 523.1 | 625.3 | 747.5 |
| Revenue Growth, % | 0 | 29.08 | 45.79 | 0.60729 | 2.68 | 19.54 | 19.54 | 19.54 | 19.54 | 19.54 |
| EBITDA | -58.2 | -67.2 | -4.7 | 25.7 | 76.8 | -27.7 | -33.2 | -39.6 | -47.4 | -56.6 |
| EBITDA, % | -36.95 | -33.05 | -1.59 | 8.62 | 25.08 | -7.58 | -7.58 | -7.58 | -7.58 | -7.58 |
| Depreciation | 72.3 | 91.9 | 97.4 | 105.0 | 122.2 | 145.7 | 174.2 | 208.3 | 249.0 | 297.6 |
| Depreciation, % | 45.9 | 45.2 | 32.86 | 35.21 | 39.91 | 39.82 | 39.82 | 39.82 | 39.82 | 39.82 |
| EBIT | -130.5 | -159.1 | -102.1 | -79.3 | -45.4 | -173.5 | -207.4 | -247.9 | -296.4 | -354.3 |
| EBIT, % | -82.86 | -78.26 | -34.45 | -26.59 | -14.83 | -47.4 | -47.4 | -47.4 | -47.4 | -47.4 |
| Total Cash | 95.3 | 247.6 | 154.5 | 84.0 | 77.4 | 194.8 | 232.9 | 278.4 | 332.7 | 397.8 |
| Total Cash, percent | .0 | .0 | .0 | .0 | .0 | .0 | .0 | .0 | .0 | .0 |
| Account Receivables | .0 | .0 | 4.0 | 1.3 | .0 | 1.3 | 1.6 | 1.9 | 2.2 | 2.7 |
| Account Receivables, % | 0 | 0 | 1.35 | 0.43595 | 0 | 0.3571 | 0.3571 | 0.3571 | 0.3571 | 0.3571 |
| Inventories | .0 | .0 | .0 | .0 | .0 | .0 | .0 | .0 | .0 | .0 |
| Inventories, % | 0 | 0 | 0 | 0 | 0 | 0 | 0 | 0 | 0 | 0 |
| Accounts Payable | 7.2 | 15.9 | 12.4 | 5.8 | 6.2 | 15.0 | 18.0 | 21.5 | 25.7 | 30.7 |
| Accounts Payable, % | 4.57 | 7.82 | 4.18 | 1.95 | 2.02 | 4.11 | 4.11 | 4.11 | 4.11 | 4.11 |
| Capital Expenditure | -78.7 | -41.1 | -71.0 | -82.5 | -53.6 | -102.0 | -121.9 | -145.7 | -174.2 | -208.3 |
| Capital Expenditure, % | -49.97 | -20.22 | -23.95 | -27.67 | -17.5 | -27.86 | -27.86 | -27.86 | -27.86 | -27.86 |
| Tax Rate, % | -0.43103 | -0.43103 | -0.43103 | -0.43103 | -0.43103 | -0.43103 | -0.43103 | -0.43103 | -0.43103 | -0.43103 |
| EBITAT | -130.5 | -158.9 | -102.0 | -79.4 | -45.6 | -173.4 | -207.3 | -247.8 | -296.2 | -354.1 |
| Depreciation | ||||||||||
| Changes in Account Receivables | ||||||||||
| Changes in Inventories | ||||||||||
| Changes in Accounts Payable | ||||||||||
| Capital Expenditure | ||||||||||
| UFCF | -129.7 | -99.4 | -83.1 | -60.8 | 24.7 | -122.1 | -152.3 | -182.0 | -217.6 | -260.1 |
| WACC, % | 6.51 | 6.51 | 6.51 | 6.51 | 6.51 | 6.51 | 6.51 | 6.51 | 6.51 | 6.51 |
| PV UFCF | ||||||||||
| SUM PV UFCF | -758.3 | |||||||||
| Long Term Growth Rate, % | 2.00 | |||||||||
| Free cash flow (T + 1) | -265 | |||||||||
| Terminal Value | -5,882 | |||||||||
| Present Terminal Value | -4,291 | |||||||||
| Enterprise Value | -5,049 | |||||||||
| Net Debt | 303 | |||||||||
| Equity Value | -5,353 | |||||||||
| Diluted Shares Outstanding, MM | 4 | |||||||||
| Equity Value Per Share | -1,417.20 |
What You Will Get
- Pre-Filled Financial Model: Rent the Runway’s actual data allows for accurate DCF valuation.
- Full Forecast Control: Modify revenue growth, margins, WACC, and other critical drivers.
- Instant Calculations: Automatic updates ensure immediate visibility of results as you make adjustments.
- Investor-Ready Template: A polished Excel file crafted for high-quality valuation.
- Customizable and Reusable: Designed for flexibility, enabling repeated use for in-depth forecasts.
Key Features
- Comprehensive Rental Management Tool: Streamlined platform for managing clothing and accessory rentals.
- Dynamic Pricing Calculator: Integrated tool for optimizing rental prices based on demand and inventory.
- Customizable Subscription Plans: Flexible options for users to tailor their rental experience.
- In-Depth Analytics Dashboard: Insights into customer behavior, rental trends, and inventory performance.
- User-Friendly Interface: Intuitive design for seamless navigation and enhanced user experience.
How It Works
- Download the Template: Gain immediate access to the Excel-based RENT DCF Calculator.
- Input Your Assumptions: Modify the yellow-highlighted cells for growth rates, WACC, margins, and other variables.
- Instant Calculations: The model automatically recalculates Rent the Runway’s intrinsic value.
- Test Scenarios: Explore various assumptions to assess potential changes in valuation.
- Analyze and Decide: Leverage the results to inform your investment or financial strategy.
Why Choose This Calculator?
- Designed for Industry Experts: A sophisticated tool tailored for fashion analysts, investors, and consultants.
- Accurate Financial Insights: Rent the Runway’s historical and projected financial data preloaded for precision.
- Flexible Scenario Analysis: Effortlessly test various forecasts and assumptions.
- Comprehensive Outputs: Automatically computes intrinsic value, NPV, and essential financial metrics.
- User-Friendly Interface: Step-by-step guidance simplifies the entire calculation process.
Who Should Use This Product?
- Fashion Enthusiasts: Make informed choices about renting or purchasing from Rent the Runway, Inc. (RENT).
- Market Analysts: Enhance trend analysis with comprehensive data on rental fashion models.
- Stylists: Provide clients with curated fashion options and rental insights quickly and efficiently.
- Retail Business Owners: Gain insights into the rental market to inform your own business strategies.
- Students of Fashion Business: Explore industry practices and rental models using real-world case studies.
What the Template Contains
- Historical Data: Includes Rent the Runway’s past financials and baseline forecasts.
- DCF and Levered DCF Models: Detailed templates to calculate Rent the Runway’s intrinsic value.
- WACC Sheet: Pre-built calculations for Weighted Average Cost of Capital.
- Editable Inputs: Modify key drivers like growth rates, EBITDA %, and CAPEX assumptions.
- Quarterly and Annual Statements: A complete breakdown of Rent the Runway’s financials.
- Interactive Dashboard: Visualize valuation results and projections dynamically.
Disclaimer
All information, articles, and product details provided on this website are for general informational and educational purposes only. We do not claim any ownership over, nor do we intend to infringe upon, any trademarks, copyrights, logos, brand names, or other intellectual property mentioned or depicted on this site. Such intellectual property remains the property of its respective owners, and any references here are made solely for identification or informational purposes, without implying any affiliation, endorsement, or partnership.
We make no representations or warranties, express or implied, regarding the accuracy, completeness, or suitability of any content or products presented. Nothing on this website should be construed as legal, tax, investment, financial, medical, or other professional advice. In addition, no part of this site—including articles or product references—constitutes a solicitation, recommendation, endorsement, advertisement, or offer to buy or sell any securities, franchises, or other financial instruments, particularly in jurisdictions where such activity would be unlawful.
All content is of a general nature and may not address the specific circumstances of any individual or entity. It is not a substitute for professional advice or services. Any actions you take based on the information provided here are strictly at your own risk. You accept full responsibility for any decisions or outcomes arising from your use of this website and agree to release us from any liability in connection with your use of, or reliance upon, the content or products found herein.