
|
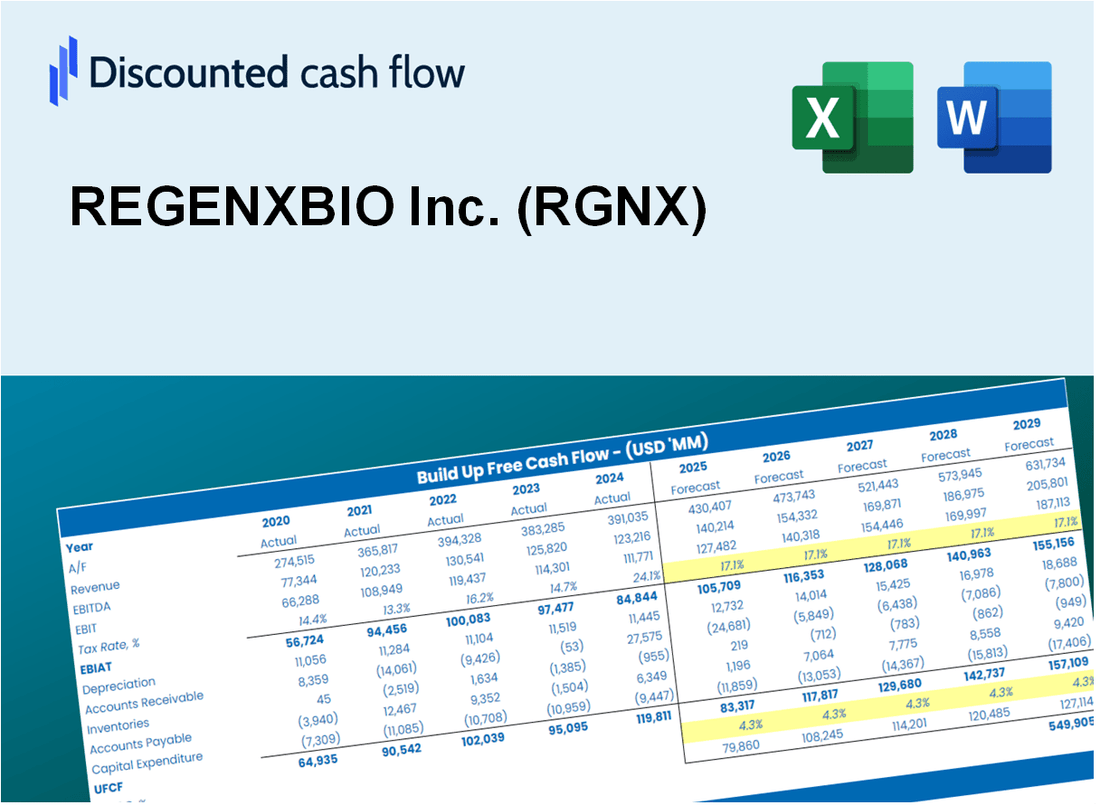
Regenxbio Inc. (RGNX) DCF -Bewertung |
Fully Editable: Tailor To Your Needs In Excel Or Sheets
Professional Design: Trusted, Industry-Standard Templates
Investor-Approved Valuation Models
MAC/PC Compatible, Fully Unlocked
No Expertise Is Needed; Easy To Follow
REGENXBIO Inc. (RGNX) Bundle
Verbessern Sie Ihre Anlagestrategien mit dem DCF -Taschenrechner des RegenxBio Inc. (RGNX)! Erforschen Sie die neuesten Finanzdaten, passen Sie Wachstumsprojektionen und -kosten an und beachten Sie, wie sich diese Modifikationen in Echtzeit auf den inneren Wert von RegenxBio Inc. (RGNX) auswirken.
What You Will Receive
- Genuine REGENXBIO Data: Preloaded financials – including revenue and EBIT – derived from real and projected figures.
- Comprehensive Customization: Modify all key parameters (yellow cells) such as WACC, growth %, and tax rates.
- Immediate Valuation Updates: Automatic recalculations to assess the effects of changes on REGENXBIO’s fair value.
- Flexible Excel Template: Designed for quick modifications, scenario analysis, and in-depth projections.
- Efficient and Precise: Avoid the hassle of building models from the ground up while ensuring accuracy and adaptability.
Key Features
- 🔍 Real-Life RGNX Financials: Pre-filled historical and projected data for REGENXBIO Inc. (RGNX).
- ✏️ Fully Customizable Inputs: Adjust all critical parameters (yellow cells) like WACC, growth %, and tax rates.
- 📊 Professional DCF Valuation: Built-in formulas calculate REGENXBIO’s intrinsic value using the Discounted Cash Flow method.
- ⚡ Instant Results: Visualize REGENXBIO’s valuation instantly after making changes.
- Scenario Analysis: Test and compare outcomes for various financial assumptions side-by-side.
How It Works
- 1. Access the Template: Download and open the Excel file containing REGENXBIO Inc.'s (RGNX) preloaded data.
- 2. Modify Assumptions: Adjust key parameters such as growth rates, WACC, and capital expenditures.
- 3. Observe Results Instantly: The DCF model automatically computes intrinsic value and NPV.
- 4. Explore Scenarios: Evaluate multiple forecasts to assess various valuation possibilities.
- 5. Present with Assurance: Deliver professional valuation insights to bolster your decision-making process.
Why Choose REGENXBIO Inc. (RGNX)?
- Innovative Solutions: Leverage cutting-edge gene therapy technologies that are transforming treatment options.
- Proven Track Record: Backed by robust clinical data demonstrating the efficacy of our therapies.
- Patient-Centric Approach: Focused on improving patient outcomes through personalized medicine.
- Expert Team: Led by industry veterans with extensive experience in biotechnology and pharmaceuticals.
- Strong Partnerships: Collaborations with leading institutions enhance our research and development capabilities.
Who Should Use This Product?
- Professional Investors: Develop comprehensive and trustworthy valuation models for assessing REGENXBIO Inc. (RGNX) in their portfolios.
- Corporate Finance Teams: Evaluate valuation scenarios to inform strategic decision-making within their organizations.
- Consultants and Advisors: Deliver precise valuation insights related to REGENXBIO Inc. (RGNX) for their clients.
- Students and Educators: Utilize real-world data to enhance financial modeling skills and education.
- Biotech Enthusiasts: Gain insights into how biotech companies like REGENXBIO Inc. (RGNX) are valued in the financial markets.
What the Template Contains
- Pre-Filled DCF Model: REGENXBIO Inc.'s (RGNX) financial data preloaded for immediate use.
- WACC Calculator: Detailed calculations for Weighted Average Cost of Capital.
- Financial Ratios: Evaluate REGENXBIO Inc.'s (RGNX) profitability, leverage, and efficiency.
- Editable Inputs: Change assumptions such as growth, margins, and CAPEX to fit your scenarios.
- Financial Statements: Annual and quarterly reports to support detailed analysis.
- Interactive Dashboard: Easily visualize key valuation metrics and results.
Disclaimer
All information, articles, and product details provided on this website are for general informational and educational purposes only. We do not claim any ownership over, nor do we intend to infringe upon, any trademarks, copyrights, logos, brand names, or other intellectual property mentioned or depicted on this site. Such intellectual property remains the property of its respective owners, and any references here are made solely for identification or informational purposes, without implying any affiliation, endorsement, or partnership.
We make no representations or warranties, express or implied, regarding the accuracy, completeness, or suitability of any content or products presented. Nothing on this website should be construed as legal, tax, investment, financial, medical, or other professional advice. In addition, no part of this site—including articles or product references—constitutes a solicitation, recommendation, endorsement, advertisement, or offer to buy or sell any securities, franchises, or other financial instruments, particularly in jurisdictions where such activity would be unlawful.
All content is of a general nature and may not address the specific circumstances of any individual or entity. It is not a substitute for professional advice or services. Any actions you take based on the information provided here are strictly at your own risk. You accept full responsibility for any decisions or outcomes arising from your use of this website and agree to release us from any liability in connection with your use of, or reliance upon, the content or products found herein.