
|
Rigetti Computing, Inc. (RGTI) DCF -Bewertung |
Fully Editable: Tailor To Your Needs In Excel Or Sheets
Professional Design: Trusted, Industry-Standard Templates
Investor-Approved Valuation Models
MAC/PC Compatible, Fully Unlocked
No Expertise Is Needed; Easy To Follow
Rigetti Computing, Inc. (RGTI) Bundle
Verbessern Sie Ihre Anlagestrategien mit dem DCF -Taschenrechner von Rigetti Computing, Inc. (RGTI)! Verwenden Sie die tatsächlichen Finanzdaten aus Rigetti, passen Sie Wachstumsprognosen und -kosten an und beobachten Sie sofort, wie diese Variationen den inneren Wert von Rigetti Computing, Inc. (RGTI) beeinflussen.
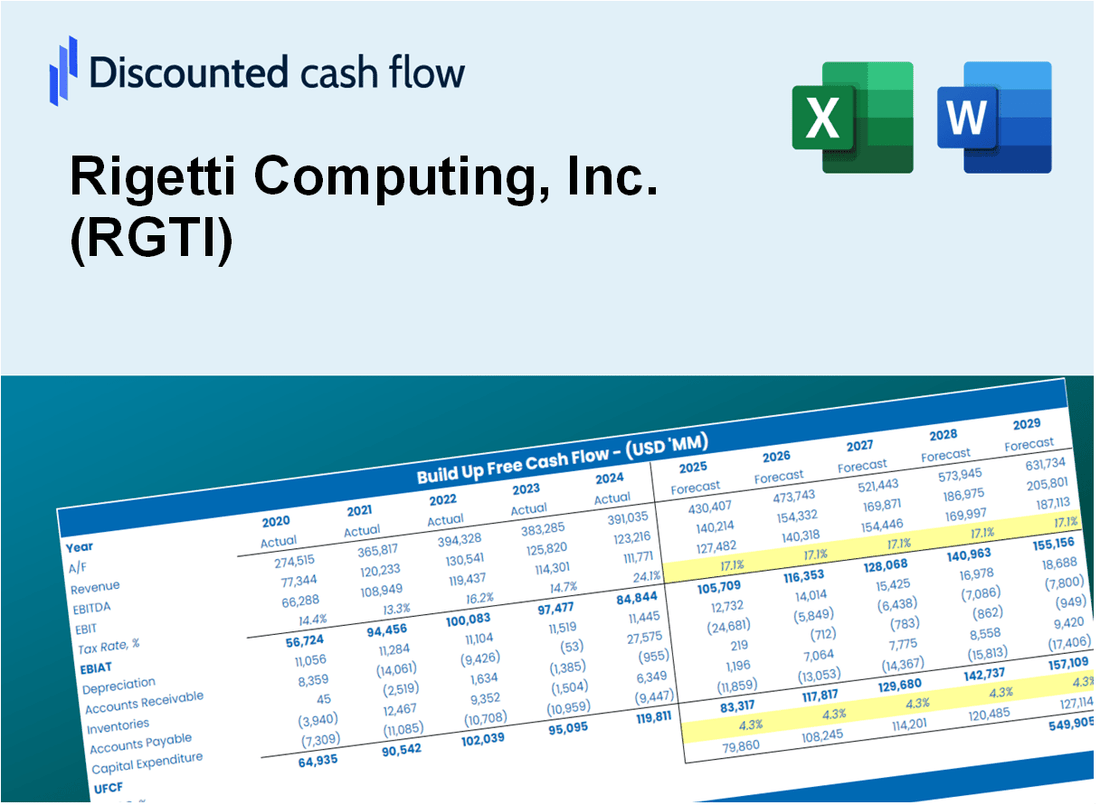
Discounted Cash Flow (DCF) - (USD MM)
| Year | AY1 2020 |
AY2 2021 |
AY3 2022 |
AY4 2023 |
AY5 2024 |
FY1 2025 |
FY2 2026 |
FY3 2027 |
FY4 2028 |
FY5 2029 |
|---|---|---|---|---|---|---|---|---|---|---|
| Revenue | 5.5 | 8.2 | 13.1 | 12.0 | 10.8 | 13.2 | 16.1 | 19.7 | 24.1 | 29.5 |
| Revenue Growth, % | 0 | 47.87 | 59.86 | -8.35 | -10.14 | 22.31 | 22.31 | 22.31 | 22.31 | 22.31 |
| EBITDA | -30.8 | -31.1 | -59.2 | -61.9 | -190.8 | -13.2 | -16.1 | -19.7 | -24.1 | -29.5 |
| EBITDA, % | -555.56 | -379.76 | -451.98 | -515.51 | -1768.55 | -100 | -100 | -100 | -100 | -100 |
| Depreciation | 4.3 | 4.7 | 7.0 | 7.4 | 6.9 | 8.3 | 10.1 | 12.4 | 15.2 | 18.5 |
| Depreciation, % | 77.57 | 56.75 | 53.56 | 61.84 | 64 | 62.74 | 62.74 | 62.74 | 62.74 | 62.74 |
| EBIT | -35.1 | -35.8 | -66.2 | -69.3 | -197.7 | -13.2 | -16.1 | -19.7 | -24.1 | -29.5 |
| EBIT, % | -633.13 | -436.51 | -505.53 | -577.35 | -1832.56 | -100 | -100 | -100 | -100 | -100 |
| Total Cash | 22.2 | 11.7 | 142.8 | 99.9 | 192.1 | 13.2 | 16.1 | 19.7 | 24.1 | 29.5 |
| Total Cash, percent | .0 | .0 | .0 | .0 | .0 | .0 | .0 | .0 | .0 | .0 |
| Account Receivables | .5 | 1.5 | 6.2 | 5.0 | 2.4 | 3.7 | 4.5 | 5.5 | 6.7 | 8.2 |
| Account Receivables, % | 8.65 | 18.83 | 47.59 | 41.88 | 22.49 | 27.89 | 27.89 | 27.89 | 27.89 | 27.89 |
| Inventories | .0 | 4.6 | 3.0 | .0 | .0 | 2.1 | 2.5 | 3.1 | 3.8 | 4.6 |
| Inventories, % | 0 | 55.68 | 22.68 | 0 | 0 | 15.67 | 15.67 | 15.67 | 15.67 | 15.67 |
| Accounts Payable | 1.1 | 2.0 | 1.9 | 5.8 | 1.6 | 3.2 | 3.9 | 4.8 | 5.9 | 7.2 |
| Accounts Payable, % | 19.99 | 24.05 | 14.79 | 48.07 | 14.74 | 24.33 | 24.33 | 24.33 | 24.33 | 24.33 |
| Capital Expenditure | -4.4 | -7.0 | -22.7 | -9.1 | -11.1 | -11.6 | -14.2 | -17.4 | -21.3 | -26.0 |
| Capital Expenditure, % | -79.39 | -85.51 | -173.54 | -75.44 | -102.85 | -88.07 | -88.07 | -88.07 | -88.07 | -88.07 |
| Tax Rate, % | 0 | 0 | 0 | 0 | 0 | 0 | 0 | 0 | 0 | 0 |
| EBITAT | -23.1 | -35.8 | -66.2 | -69.3 | -197.7 | -12.3 | -15.0 | -18.4 | -22.5 | -27.5 |
| Depreciation | ||||||||||
| Changes in Account Receivables | ||||||||||
| Changes in Inventories | ||||||||||
| Changes in Accounts Payable | ||||||||||
| Capital Expenditure | ||||||||||
| UFCF | -22.6 | -42.9 | -85.1 | -63.0 | -203.5 | -17.3 | -19.7 | -24.1 | -29.5 | -36.0 |
| WACC, % | 11.54 | 11.56 | 11.56 | 11.56 | 11.56 | 11.56 | 11.56 | 11.56 | 11.56 | 11.56 |
| PV UFCF | ||||||||||
| SUM PV UFCF | -88.6 | |||||||||
| Long Term Growth Rate, % | 2.00 | |||||||||
| Free cash flow (T + 1) | -37 | |||||||||
| Terminal Value | -385 | |||||||||
| Present Terminal Value | -223 | |||||||||
| Enterprise Value | -311 | |||||||||
| Net Debt | -59 | |||||||||
| Equity Value | -252 | |||||||||
| Diluted Shares Outstanding, MM | 185 | |||||||||
| Equity Value Per Share | -1.37 |
What You Will Get
- Editable Forecast Inputs: Easily modify assumptions (growth %, margins, WACC) to explore various scenarios.
- Real-World Data: Rigetti Computing's financial data pre-filled to accelerate your analysis.
- Automatic DCF Outputs: The template computes Net Present Value (NPV) and intrinsic value automatically.
- Customizable and Professional: A refined Excel model that adjusts to your valuation requirements.
- Built for Analysts and Investors: Perfect for evaluating projections, validating strategies, and optimizing time.
Key Features
- 🔍 Real-Life RGTI Financials: Pre-filled historical and projected data for Rigetti Computing, Inc.
- ✏️ Fully Customizable Inputs: Adjust all critical parameters (yellow cells) like WACC, growth %, and tax rates.
- 📊 Professional DCF Valuation: Built-in formulas calculate Rigetti’s intrinsic value using the Discounted Cash Flow method.
- ⚡ Instant Results: Visualize Rigetti’s valuation instantly after making changes.
- Scenario Analysis: Test and compare outcomes for various financial assumptions side-by-side.
How It Works
- Step 1: Download the prebuilt Excel template featuring Rigetti Computing’s data.
- Step 2: Review the pre-filled sheets to familiarize yourself with the essential metrics.
- Step 3: Modify forecasts and assumptions in the editable yellow cells (WACC, growth, margins).
- Step 4: Instantly see the recalculated results, including Rigetti Computing’s intrinsic value.
- Step 5: Make well-informed investment decisions or create reports based on the outputs.
Why Choose Rigetti Computing?
- Cutting-Edge Technology: Access advanced quantum computing capabilities tailored for your needs.
- Enhanced Performance: Leverage powerful algorithms that optimize computational efficiency.
- Flexible Solutions: Customize our quantum services to fit your specific project requirements.
- User-Friendly Interface: Intuitive tools and dashboards simplify the quantum computing experience.
- Backed by Experts: Developed by a team of quantum computing professionals dedicated to innovation.
Who Should Use This Product?
- Investors: Accurately estimate Rigetti Computing’s fair value before making investment decisions.
- CFOs: Leverage a professional-grade DCF model for financial reporting and analysis specific to Rigetti Computing (RGTI).
- Consultants: Quickly adapt the template for valuation reports tailored to clients interested in Rigetti Computing (RGTI).
- Entrepreneurs: Gain insights into the financial modeling techniques utilized by leading tech companies like Rigetti Computing (RGTI).
- Educators: Use it as a teaching tool to demonstrate valuation methodologies relevant to the tech industry, including Rigetti Computing (RGTI).
What the Template Contains
- Pre-Filled Data: Includes Rigetti Computing’s historical financials and projections.
- Discounted Cash Flow Model: Editable DCF valuation model with automated calculations.
- Weighted Average Cost of Capital (WACC): A dedicated sheet for calculating WACC using custom inputs.
- Key Financial Ratios: Examine Rigetti’s profitability, efficiency, and leverage metrics.
- Customizable Inputs: Easily adjust revenue growth, profit margins, and tax rates.
- Clear Dashboard: Visual representations and tables summarizing key valuation outcomes.
Disclaimer
All information, articles, and product details provided on this website are for general informational and educational purposes only. We do not claim any ownership over, nor do we intend to infringe upon, any trademarks, copyrights, logos, brand names, or other intellectual property mentioned or depicted on this site. Such intellectual property remains the property of its respective owners, and any references here are made solely for identification or informational purposes, without implying any affiliation, endorsement, or partnership.
We make no representations or warranties, express or implied, regarding the accuracy, completeness, or suitability of any content or products presented. Nothing on this website should be construed as legal, tax, investment, financial, medical, or other professional advice. In addition, no part of this site—including articles or product references—constitutes a solicitation, recommendation, endorsement, advertisement, or offer to buy or sell any securities, franchises, or other financial instruments, particularly in jurisdictions where such activity would be unlawful.
All content is of a general nature and may not address the specific circumstances of any individual or entity. It is not a substitute for professional advice or services. Any actions you take based on the information provided here are strictly at your own risk. You accept full responsibility for any decisions or outcomes arising from your use of this website and agree to release us from any liability in connection with your use of, or reliance upon, the content or products found herein.