
|
Rhi Magnesita India Limited (RHIM.NS) DCF -Bewertung |
Fully Editable: Tailor To Your Needs In Excel Or Sheets
Professional Design: Trusted, Industry-Standard Templates
Investor-Approved Valuation Models
MAC/PC Compatible, Fully Unlocked
No Expertise Is Needed; Easy To Follow
RHI Magnesita India Limited (RHIM.NS) Bundle
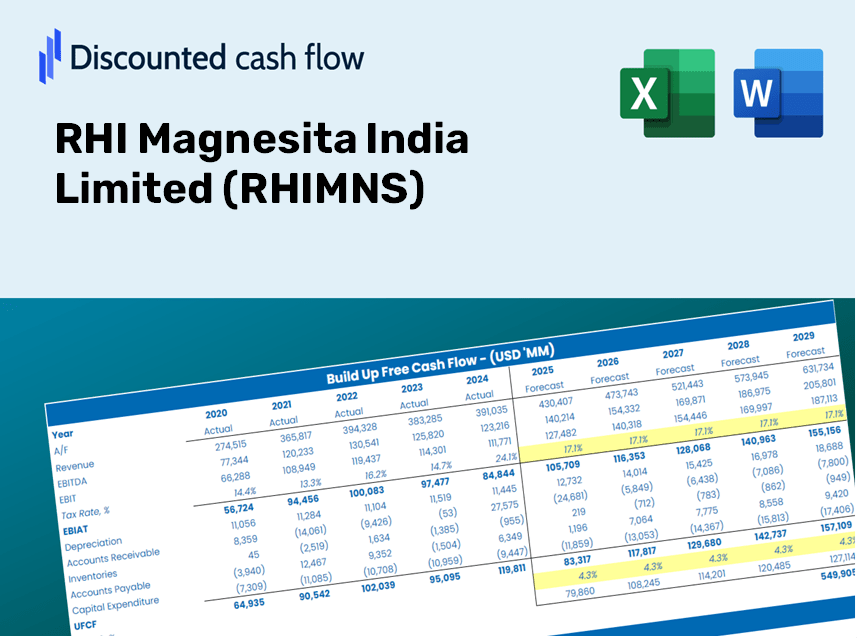
Gewinnen Sie einen Einblick in Ihre RHI Magnesita India Limited (RHIMNS) Bewertungsanalyse mit unserem ausgefeilten DCF -Taschenrechner! Diese Excel -Vorlage wird mit genauen (RHIMNS) -Daten vorinstalliert, sodass Sie Prognosen und Annahmen anpassen können, um den intrinsischen Wert von RHI Magnesita India mit Präzision begrenzt zu bestimmen.
Discounted Cash Flow (DCF) - (USD MM)
| Year | AY1 2021 |
AY2 2022 |
AY3 2023 |
AY4 2024 |
AY5 2025 |
FY1 2026 |
FY2 2027 |
FY3 2028 |
FY4 2029 |
FY5 2030 |
|---|---|---|---|---|---|---|---|---|---|---|
| Revenue | 13,614.0 | 19,993.7 | 27,262.7 | 37,811.0 | 36,745.0 | 47,684.8 | 61,881.7 | 80,305.3 | 104,214.0 | 135,241.0 |
| Revenue Growth, % | 0 | 46.86 | 36.36 | 38.69 | -2.82 | 29.77 | 29.77 | 29.77 | 29.77 | 29.77 |
| EBITDA | 2,207.8 | 3,944.8 | -2,900.9 | 2,346.8 | 5,051.5 | 4,316.5 | 5,601.6 | 7,269.3 | 9,433.6 | 12,242.2 |
| EBITDA, % | 16.22 | 19.73 | -10.64 | 6.21 | 13.75 | 9.05 | 9.05 | 9.05 | 9.05 | 9.05 |
| Depreciation | 297.9 | 338.3 | 709.0 | 1,936.7 | 1,999.2 | 1,625.5 | 2,109.4 | 2,737.4 | 3,552.4 | 4,610.1 |
| Depreciation, % | 2.19 | 1.69 | 2.6 | 5.12 | 5.44 | 3.41 | 3.41 | 3.41 | 3.41 | 3.41 |
| EBIT | 1,909.8 | 3,606.6 | -3,609.9 | 410.1 | 3,052.3 | 2,691.0 | 3,492.2 | 4,531.9 | 5,881.2 | 7,632.1 |
| EBIT, % | 14.03 | 18.04 | -13.24 | 1.08 | 8.31 | 5.64 | 5.64 | 5.64 | 5.64 | 5.64 |
| Total Cash | 1,566.4 | 628.1 | 3,230.7 | 507.9 | 974.8 | 2,908.2 | 3,774.0 | 4,897.6 | 6,355.7 | 8,248.0 |
| Total Cash, percent | .0 | .0 | .0 | .0 | .0 | .0 | .0 | .0 | .0 | .0 |
| Account Receivables | 3,890.2 | 5,887.4 | 11,251.1 | 10,691.0 | 9,795.0 | 14,708.1 | 19,087.0 | 24,769.7 | 32,144.2 | 41,714.2 |
| Account Receivables, % | 28.57 | 29.45 | 41.27 | 28.27 | 26.66 | 30.84 | 30.84 | 30.84 | 30.84 | 30.84 |
| Inventories | 3,530.9 | 6,080.4 | 9,562.0 | 9,053.2 | 10,735.5 | 13,788.5 | 17,893.7 | 23,221.1 | 30,134.6 | 39,106.3 |
| Inventories, % | 25.94 | 30.41 | 35.07 | 23.94 | 29.22 | 28.92 | 28.92 | 28.92 | 28.92 | 28.92 |
| Accounts Payable | 3,479.0 | 5,266.7 | 8,438.0 | 5,828.2 | 6,216.5 | 10,984.6 | 14,254.9 | 18,499.0 | 24,006.5 | 31,153.8 |
| Accounts Payable, % | 25.55 | 26.34 | 30.95 | 15.41 | 16.92 | 23.04 | 23.04 | 23.04 | 23.04 | 23.04 |
| Capital Expenditure | -858.0 | -624.5 | -451.7 | -821.4 | -1,191.2 | -1,573.3 | -2,041.7 | -2,649.5 | -3,438.4 | -4,462.0 |
| Capital Expenditure, % | -6.3 | -3.12 | -1.66 | -2.17 | -3.24 | -3.3 | -3.3 | -3.3 | -3.3 | -3.3 |
| Tax Rate, % | 22.9 | 22.9 | 22.9 | 22.9 | 22.9 | 22.9 | 22.9 | 22.9 | 22.9 | 22.9 |
| EBITAT | 1,413.6 | 2,713.9 | -4,245.8 | 2,656.5 | 2,353.4 | 2,294.7 | 2,977.9 | 3,864.5 | 5,015.1 | 6,508.2 |
| Depreciation | ||||||||||
| Changes in Account Receivables | ||||||||||
| Changes in Inventories | ||||||||||
| Changes in Accounts Payable | ||||||||||
| Capital Expenditure | ||||||||||
| UFCF | -3,088.5 | -331.4 | -9,662.4 | 2,230.9 | 2,763.4 | -851.1 | -2,168.1 | -2,813.6 | -3,651.2 | -4,738.3 |
| WACC, % | 4.81 | 4.82 | 4.92 | 4.92 | 4.83 | 4.86 | 4.86 | 4.86 | 4.86 | 4.86 |
| PV UFCF | ||||||||||
| SUM PV UFCF | -11,981.2 | |||||||||
| Long Term Growth Rate, % | 2.00 | |||||||||
| Free cash flow (T + 1) | -4,833 | |||||||||
| Terminal Value | -169,013 | |||||||||
| Present Terminal Value | -133,315 | |||||||||
| Enterprise Value | -145,296 | |||||||||
| Net Debt | 2,805 | |||||||||
| Equity Value | -148,101 | |||||||||
| Diluted Shares Outstanding, MM | 207 | |||||||||
| Equity Value Per Share | -716.54 |
What You Will Receive
- Authentic RHIMNS Financial Data: Pre-loaded with RHI Magnesita India Limited’s historical and estimated data for thorough analysis.
- Completely Customizable Template: Easily adjust key inputs such as revenue growth, WACC, and EBITDA margin.
- Instant Calculations: Watch RHI Magnesita’s intrinsic value refresh automatically based on your adjustments.
- Professional Valuation Tool: Crafted for investors, analysts, and consultants aiming for precise DCF outcomes.
- User-Centric Layout: Intuitive design and straightforward instructions suitable for all skill levels.
Key Features
- Comprehensive DCF Calculator: Offers detailed unlevered and levered DCF valuation models specifically for RHI Magnesita India Limited (RHIMNS).
- WACC Estimator: Features a pre-configured Weighted Average Cost of Capital sheet with flexible input options.
- Customizable Forecast Inputs: Adjust growth rates, capital expenditures, and discount rates to fit your analysis of RHI Magnesita India Limited (RHIMNS).
- Integrated Financial Ratios: Evaluate profitability, leverage, and efficiency ratios for RHI Magnesita India Limited (RHIMNS).
- Interactive Dashboard and Charts: Visual representations highlight essential valuation metrics for comprehensive analysis.
How It Works
- Step 1: Download the prebuilt Excel template featuring RHI Magnesita India Limited's (RHIMNS) data.
- Step 2: Navigate through the pre-filled sheets to familiarize yourself with the essential metrics.
- Step 3: Modify the forecasts and assumptions in the editable yellow cells (WACC, growth, margins) as needed.
- Step 4: Witness the recalculated results in real-time, including RHI Magnesita India Limited's (RHIMNS) intrinsic value.
- Step 5: Utilize the outputs to make informed investment decisions or to create comprehensive reports.
Why Opt for This Calculator?
- Reliable Data: Accurate financials from RHI Magnesita India Limited (RHIMNS) guarantee trustworthy valuation outcomes.
- Customizable Options: Tailor key metrics such as growth rates, WACC, and tax rates to fit your forecasts.
- Time-Efficient: Ready-to-use calculations save you the effort of starting from the ground up.
- Professional Quality: Crafted for investors, analysts, and consultants alike.
- User-Friendly Interface: An intuitive design and comprehensive instructions ensure accessibility for all users.
Who Can Benefit from This Product?
- Finance Students: Master valuation methods and apply them using real-world data.
- Academics: Integrate industry-standard models into your teaching or research projects.
- Investors: Validate your hypotheses and analyze valuation scenarios for RHI Magnesita India Limited (RHIMNS).
- Analysts: Enhance your efficiency with a customizable DCF model designed for your specific needs.
- Small Business Owners: Discover how major public entities like RHI Magnesita India Limited (RHIMNS) are evaluated in the market.
What the Template Contains
- Historical Data: Contains RHI Magnesita India Limited's (RHIMNS) previous financials and foundational forecasts.
- DCF and Levered DCF Models: Comprehensive templates to assess the intrinsic value of RHI Magnesita India Limited (RHIMNS).
- WACC Sheet: Pre-configured calculations for the Weighted Average Cost of Capital.
- Editable Inputs: Customize key variables such as growth rates, EBITDA percentages, and CAPEX assumptions.
- Quarterly and Annual Statements: An in-depth analysis of RHI Magnesita India Limited's (RHIMNS) financial performance.
- Interactive Dashboard: Dynamically visualize valuation results and future projections.
Disclaimer
All information, articles, and product details provided on this website are for general informational and educational purposes only. We do not claim any ownership over, nor do we intend to infringe upon, any trademarks, copyrights, logos, brand names, or other intellectual property mentioned or depicted on this site. Such intellectual property remains the property of its respective owners, and any references here are made solely for identification or informational purposes, without implying any affiliation, endorsement, or partnership.
We make no representations or warranties, express or implied, regarding the accuracy, completeness, or suitability of any content or products presented. Nothing on this website should be construed as legal, tax, investment, financial, medical, or other professional advice. In addition, no part of this site—including articles or product references—constitutes a solicitation, recommendation, endorsement, advertisement, or offer to buy or sell any securities, franchises, or other financial instruments, particularly in jurisdictions where such activity would be unlawful.
All content is of a general nature and may not address the specific circumstances of any individual or entity. It is not a substitute for professional advice or services. Any actions you take based on the information provided here are strictly at your own risk. You accept full responsibility for any decisions or outcomes arising from your use of this website and agree to release us from any liability in connection with your use of, or reliance upon, the content or products found herein.