
|
Rivian Automotive, Inc. (Rivn) DCF -Bewertung |
Fully Editable: Tailor To Your Needs In Excel Or Sheets
Professional Design: Trusted, Industry-Standard Templates
Investor-Approved Valuation Models
MAC/PC Compatible, Fully Unlocked
No Expertise Is Needed; Easy To Follow
Rivian Automotive, Inc. (RIVN) Bundle
Unser DCF-Taschenrechner von Rivian Automotive, Inc. (RIVN) für die Genauigkeit ermöglicht es Ihnen, die Bewertung des Unternehmens mithilfe realer Finanzdaten zu bewerten, sowie die vollständige Flexibilität, um alle wesentlichen Parameter für verbesserte Projektionen zu ändern.
Discounted Cash Flow (DCF) - (USD MM)
| Year | AY1 2020 |
AY2 2021 |
AY3 2022 |
AY4 2023 |
AY5 2024 |
FY1 2025 |
FY2 2026 |
FY3 2027 |
FY4 2028 |
FY5 2029 |
|---|---|---|---|---|---|---|---|---|---|---|
| Revenue | .0 | 55.0 | 1,658.0 | 4,434.0 | 4,970.0 | 7,605.2 | 11,637.6 | 17,808.2 | 27,250.4 | 41,699.2 |
| Revenue Growth, % | 0 | 0 | 2914.55 | 167.43 | 12.09 | 53.02 | 53.02 | 53.02 | 53.02 | 53.02 |
| EBITDA | -981.0 | -4,462.0 | -5,993.0 | -4,274.0 | -3,392.0 | -4,025.3 | -6,159.6 | -9,425.5 | -14,423.2 | -22,070.6 |
| EBITDA, % | 100 | -8112.73 | -361.46 | -96.39 | -68.25 | -52.93 | -52.93 | -52.93 | -52.93 | -52.93 |
| Depreciation | 29.0 | 197.0 | 652.0 | 937.0 | 1,031.0 | 4,277.2 | 6,545.0 | 10,015.3 | 15,325.7 | 23,451.7 |
| Depreciation, % | 100 | 358.18 | 39.32 | 21.13 | 20.74 | 56.24 | 56.24 | 56.24 | 56.24 | 56.24 |
| EBIT | -1,010.0 | -4,659.0 | -6,645.0 | -5,211.0 | -4,423.0 | -4,395.7 | -6,726.4 | -10,292.9 | -15,750.4 | -24,101.6 |
| EBIT, % | 100 | -8470.91 | -400.78 | -117.52 | -88.99 | -57.8 | -57.8 | -57.8 | -57.8 | -57.8 |
| Total Cash | 2,979.0 | 18,133.0 | 11,568.0 | 9,368.0 | 7,700.0 | 7,605.2 | 11,637.6 | 17,808.2 | 27,250.4 | 41,699.2 |
| Total Cash, percent | .0 | .0 | .0 | .0 | .0 | .0 | .0 | .0 | .0 | .0 |
| Account Receivables | 6.0 | 26.0 | 102.0 | 161.0 | 443.0 | 2,524.5 | 3,863.0 | 5,911.2 | 9,045.5 | 13,841.6 |
| Account Receivables, % | 100 | 47.27 | 6.15 | 3.63 | 8.91 | 33.19 | 33.19 | 33.19 | 33.19 | 33.19 |
| Inventories | -6.0 | 274.0 | 1,348.0 | 2,620.0 | 2,248.0 | 5,865.5 | 8,975.5 | 13,734.5 | 21,016.8 | 32,160.3 |
| Inventories, % | 100 | 498.18 | 81.3 | 59.09 | 45.23 | 77.12 | 77.12 | 77.12 | 77.12 | 77.12 |
| Accounts Payable | 90.0 | 483.0 | 1,000.0 | 981.0 | 499.0 | 4,448.7 | 6,807.5 | 10,417.0 | 15,940.3 | 24,392.2 |
| Accounts Payable, % | 100 | 878.18 | 60.31 | 22.12 | 10.04 | 58.5 | 58.5 | 58.5 | 58.5 | 58.5 |
| Capital Expenditure | -914.0 | -1,794.0 | -1,369.0 | -1,026.0 | -1,141.0 | -3,478.1 | -5,322.3 | -8,144.3 | -12,462.5 | -19,070.4 |
| Capital Expenditure, % | 100 | -3261.82 | -82.57 | -23.14 | -22.96 | -45.73 | -45.73 | -45.73 | -45.73 | -45.73 |
| Tax Rate, % | -0.10546 | -0.10546 | -0.10546 | -0.10546 | -0.10546 | -0.10546 | -0.10546 | -0.10546 | -0.10546 | -0.10546 |
| EBITAT | -1,011.0 | -4,659.0 | -6,648.9 | -5,212.0 | -4,427.7 | -4,395.7 | -6,726.4 | -10,292.9 | -15,750.4 | -24,101.6 |
| Depreciation | ||||||||||
| Changes in Account Receivables | ||||||||||
| Changes in Inventories | ||||||||||
| Changes in Accounts Payable | ||||||||||
| Capital Expenditure | ||||||||||
| UFCF | -1,806.0 | -6,163.0 | -7,998.9 | -6,651.0 | -4,929.7 | -5,345.9 | -7,593.4 | -11,619.5 | -17,780.5 | -27,208.0 |
| WACC, % | 10.74 | 10.74 | 10.74 | 10.74 | 10.74 | 10.74 | 10.74 | 10.74 | 10.74 | 10.74 |
| PV UFCF | ||||||||||
| SUM PV UFCF | -47,728.8 | |||||||||
| Long Term Growth Rate, % | 2.00 | |||||||||
| Free cash flow (T + 1) | -27,752 | |||||||||
| Terminal Value | -317,376 | |||||||||
| Present Terminal Value | -190,532 | |||||||||
| Enterprise Value | -238,261 | |||||||||
| Net Debt | 443 | |||||||||
| Equity Value | -238,704 | |||||||||
| Diluted Shares Outstanding, MM | 1,013 | |||||||||
| Equity Value Per Share | -235.64 |
What You Will Get
- Editable Excel Template: A fully customizable Excel-based DCF Calculator featuring pre-filled financials for Rivian Automotive, Inc. (RIVN).
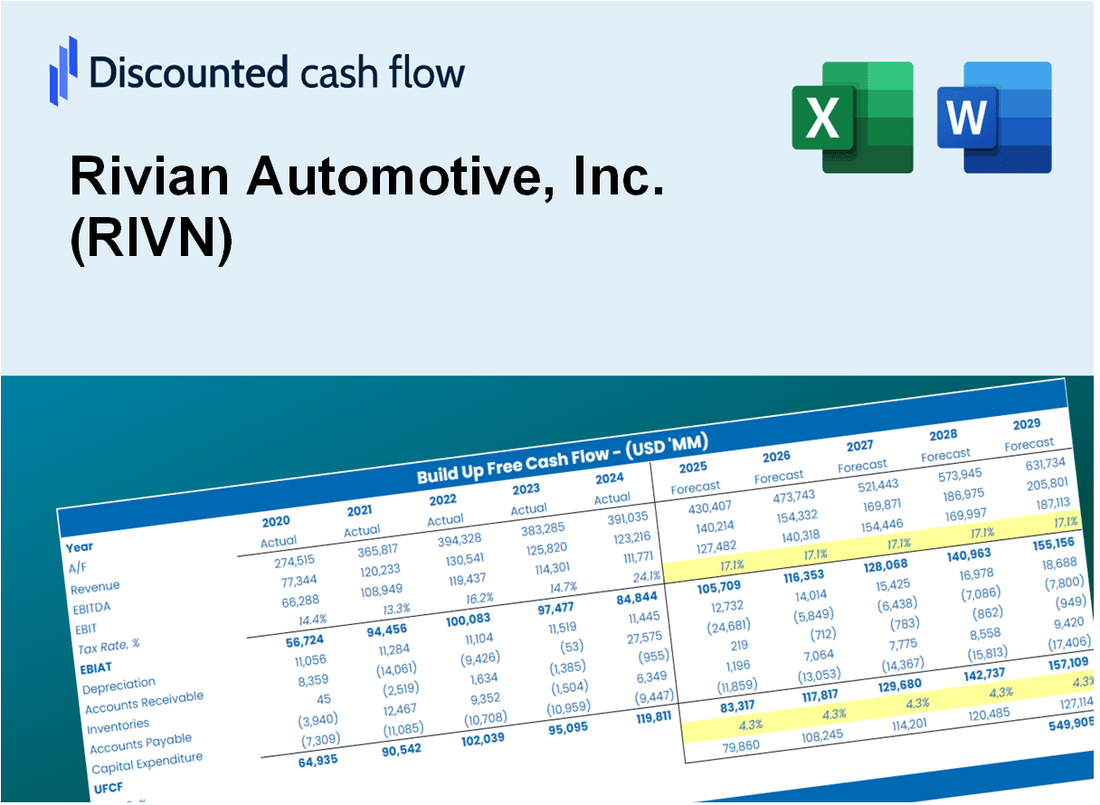
- Real-World Data: Access to historical data and forward-looking estimates (highlighted in the yellow cells).
- Forecast Flexibility: Adjust forecast assumptions such as revenue growth, EBITDA %, and WACC.
- Automatic Calculations: Instantly observe how your inputs affect Rivian’s valuation.
- Professional Tool: Designed for investors, CFOs, consultants, and financial analysts.
- User-Friendly Design: Organized for clarity and ease of use, complete with step-by-step instructions.
Key Features
- 🔍 Real-Life RIVN Financials: Pre-filled historical and projected data for Rivian Automotive, Inc.
- ✏️ Fully Customizable Inputs: Adjust all critical parameters (yellow cells) like WACC, growth %, and tax rates.
- 📊 Professional DCF Valuation: Built-in formulas calculate Rivian’s intrinsic value using the Discounted Cash Flow method.
- ⚡ Instant Results: Visualize Rivian’s valuation instantly after making changes.
- Scenario Analysis: Test and compare outcomes for various financial assumptions side-by-side.
How It Works
- 1. Open the Template: Download and open the Excel file containing Rivian Automotive, Inc.'s (RIVN) preloaded data.
- 2. Edit Assumptions: Modify key inputs such as growth rates, WACC, and capital expenditures specific to Rivian Automotive, Inc. (RIVN).
- 3. View Results Instantly: The DCF model automatically calculates the intrinsic value and NPV for Rivian Automotive, Inc. (RIVN).
- 4. Test Scenarios: Evaluate various forecasts to analyze different valuation outcomes for Rivian Automotive, Inc. (RIVN).
- 5. Use with Confidence: Present professional valuation insights regarding Rivian Automotive, Inc. (RIVN) to support your decisions.
Why Choose Rivian Automotive, Inc. (RIVN)?
- Innovative Technology: Experience cutting-edge electric vehicle technology designed for performance.
- Sustainable Practices: Committed to environmentally friendly manufacturing and operations.
- Exceptional Range: Enjoy long-range capabilities that enhance your driving experience.
- Customizable Options: Personalize your vehicle with a range of features and configurations.
- Backed by Industry Experts: Supported by a team of professionals dedicated to quality and innovation.
Who Should Use This Product?
- Individual Investors: Make informed decisions about buying or selling Rivian stock (RIVN).
- Financial Analysts: Streamline valuation processes with ready-to-use financial models for Rivian (RIVN).
- Consultants: Deliver professional valuation insights on Rivian (RIVN) to clients quickly and accurately.
- Business Owners: Understand how innovative companies like Rivian (RIVN) are valued to guide your own strategy.
- Finance Students: Learn valuation techniques using real-world data and scenarios related to Rivian (RIVN).
What the Template Contains
- Operating and Balance Sheet Data: Pre-filled Rivian Automotive historical data and forecasts, including revenue, EBITDA, EBIT, and capital expenditures.
- WACC Calculation: A dedicated sheet for Weighted Average Cost of Capital (WACC), featuring parameters like Beta, risk-free rate, and share price.
- DCF Valuation (Unlevered and Levered): Editable Discounted Cash Flow models showcasing intrinsic value with detailed calculations.
- Financial Statements: Pre-loaded financial statements (annual and quarterly) to support analysis.
- Key Ratios: Includes profitability, leverage, and efficiency ratios for Rivian Automotive, Inc. (RIVN).
- Dashboard and Charts: Visual summary of valuation outputs and assumptions to facilitate easy analysis of results.
Disclaimer
All information, articles, and product details provided on this website are for general informational and educational purposes only. We do not claim any ownership over, nor do we intend to infringe upon, any trademarks, copyrights, logos, brand names, or other intellectual property mentioned or depicted on this site. Such intellectual property remains the property of its respective owners, and any references here are made solely for identification or informational purposes, without implying any affiliation, endorsement, or partnership.
We make no representations or warranties, express or implied, regarding the accuracy, completeness, or suitability of any content or products presented. Nothing on this website should be construed as legal, tax, investment, financial, medical, or other professional advice. In addition, no part of this site—including articles or product references—constitutes a solicitation, recommendation, endorsement, advertisement, or offer to buy or sell any securities, franchises, or other financial instruments, particularly in jurisdictions where such activity would be unlawful.
All content is of a general nature and may not address the specific circumstances of any individual or entity. It is not a substitute for professional advice or services. Any actions you take based on the information provided here are strictly at your own risk. You accept full responsibility for any decisions or outcomes arising from your use of this website and agree to release us from any liability in connection with your use of, or reliance upon, the content or products found herein.