
|
Rallybio Corporation (RLYB) DCF -Bewertung |
Fully Editable: Tailor To Your Needs In Excel Or Sheets
Professional Design: Trusted, Industry-Standard Templates
Investor-Approved Valuation Models
MAC/PC Compatible, Fully Unlocked
No Expertise Is Needed; Easy To Follow
Rallybio Corporation (RLYB) Bundle
Stürzen Sie Ihre Analyse und verbessern Sie die Präzision mit unserem (RLYB) DCF -Taschenrechner! Mithilfe der tatsächlichen Daten der Rallyio Corporation und der anpassbaren Annahmen ermöglichen dieses Tool Sie, Rallybio wie einen erfahrenen Investor zu prognostizieren, zu analysieren und zu schätzen.
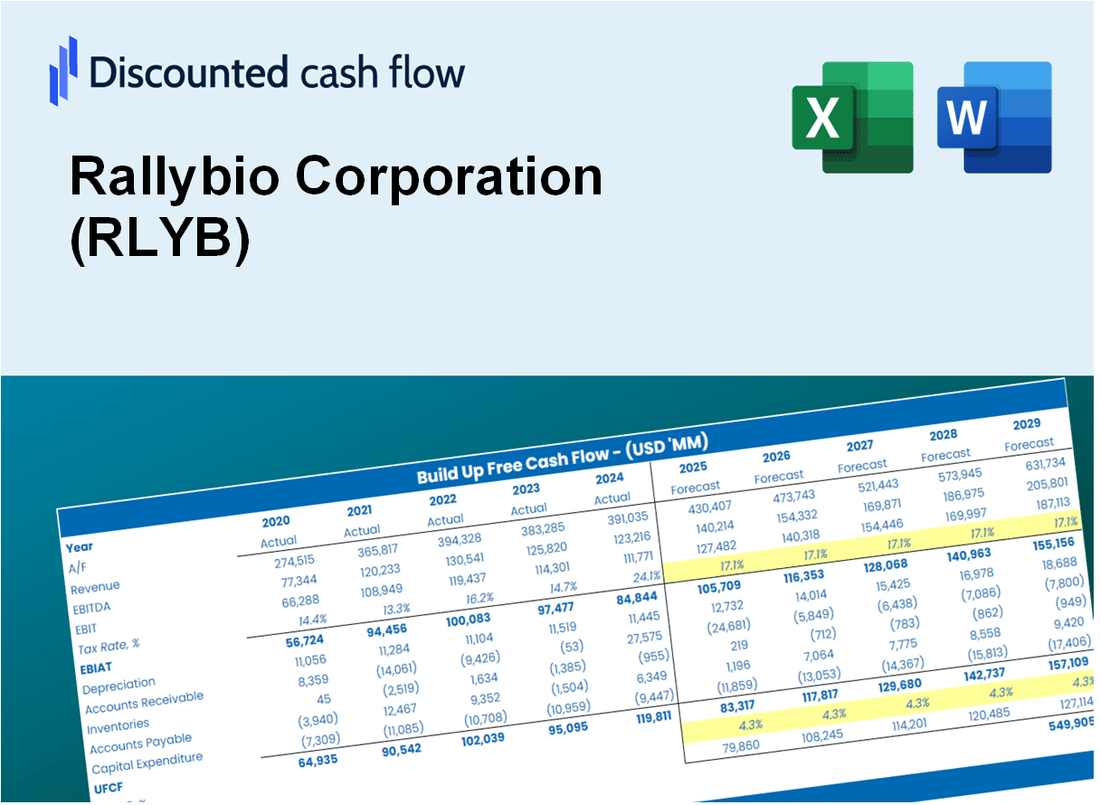
Discounted Cash Flow (DCF) - (USD MM)
| Year | AY1 2020 |
AY2 2021 |
AY3 2022 |
AY4 2023 |
AY5 2024 |
FY1 2025 |
FY2 2026 |
FY3 2027 |
FY4 2028 |
FY5 2029 |
|---|---|---|---|---|---|---|---|---|---|---|
| Revenue | .0 | .0 | .0 | .0 | .6 | .6 | .6 | .6 | .6 | .6 |
| Revenue Growth, % | 0 | 0 | 0 | 0 | 0 | 0 | 0 | 0 | 0 | 0 |
| EBITDA | -25.2 | -45.4 | -67.7 | -78.8 | -60.4 | .4 | .4 | .4 | .4 | .4 |
| EBITDA, % | 100 | 100 | 100 | 100 | -9491.35 | 60 | 60 | 60 | 60 | 60 |
| Depreciation | .1 | .1 | .2 | .2 | .1 | .5 | .5 | .5 | .5 | .5 |
| Depreciation, % | 100 | 100 | 100 | 100 | 20.6 | 84.12 | 84.12 | 84.12 | 84.12 | 84.12 |
| EBIT | -25.3 | -45.5 | -67.9 | -78.9 | -60.5 | .4 | .4 | .4 | .4 | .4 |
| EBIT, % | 100 | 100 | 100 | 100 | -9511.95 | 60 | 60 | 60 | 60 | 60 |
| Total Cash | 140.2 | 175.3 | 169.0 | 109.9 | 65.5 | .6 | .6 | .6 | .6 | .6 |
| Total Cash, percent | .0 | .0 | .0 | .0 | .0 | .0 | .0 | .0 | .0 | .0 |
| Account Receivables | .0 | .0 | .0 | .0 | .0 | .5 | .5 | .5 | .5 | .5 |
| Account Receivables, % | 100 | 100 | 100 | 100 | 0 | 80 | 80 | 80 | 80 | 80 |
| Inventories | .0 | .0 | .0 | .0 | .0 | .5 | .5 | .5 | .5 | .5 |
| Inventories, % | 100 | 100 | 100 | 100 | 0 | 80 | 80 | 80 | 80 | 80 |
| Accounts Payable | 1.6 | .6 | 1.1 | 1.0 | .3 | .6 | .6 | .6 | .6 | .6 |
| Accounts Payable, % | 100 | 100 | 100 | 100 | 43.71 | 88.74 | 88.74 | 88.74 | 88.74 | 88.74 |
| Capital Expenditure | -.1 | -.3 | -.1 | .0 | .0 | .0 | .0 | .0 | .0 | .0 |
| Capital Expenditure, % | 100 | 100 | 100 | 100 | 0 | 0 | 0 | 0 | 0 | 0 |
| Tax Rate, % | 0 | 0 | 0 | 0 | 0 | 0 | 0 | 0 | 0 | 0 |
| EBITAT | -25.3 | -45.5 | -66.8 | -78.9 | -60.5 | .4 | .4 | .4 | .4 | .4 |
| Depreciation | ||||||||||
| Changes in Account Receivables | ||||||||||
| Changes in Inventories | ||||||||||
| Changes in Accounts Payable | ||||||||||
| Capital Expenditure | ||||||||||
| UFCF | -23.8 | -46.7 | -66.2 | -78.9 | -61.1 | .2 | .9 | .9 | .9 | .9 |
| WACC, % | 4.68 | 4.68 | 4.68 | 4.68 | 4.68 | 4.68 | 4.68 | 4.68 | 4.68 | 4.68 |
| PV UFCF | ||||||||||
| SUM PV UFCF | 3.3 | |||||||||
| Long Term Growth Rate, % | 2.00 | |||||||||
| Free cash flow (T + 1) | 1 | |||||||||
| Terminal Value | 35 | |||||||||
| Present Terminal Value | 28 | |||||||||
| Enterprise Value | 31 | |||||||||
| Net Debt | -14 | |||||||||
| Equity Value | 45 | |||||||||
| Diluted Shares Outstanding, MM | 44 | |||||||||
| Equity Value Per Share | 1.03 |
What You Will Receive
- Comprehensive Financial Model: Rallybio Corporation’s actual data facilitates accurate DCF valuation.
- Complete Forecast Control: Modify revenue growth, profit margins, WACC, and other essential factors.
- Real-Time Calculations: Automatic updates provide immediate results as you make adjustments.
- Professional-Grade Template: A polished Excel file crafted for high-quality valuation presentations.
- Flexible and Reusable: Designed for adaptability, allowing for repeated application in detailed forecasting.
Key Features
- Real-Life RLYB Data: Pre-filled with Rallybio Corporation’s historical financials and future projections.
- Fully Customizable Inputs: Modify revenue growth, profit margins, WACC, tax rates, and capital expenditures to fit your analysis.
- Dynamic Valuation Model: Automatic updates to Net Present Value (NPV) and intrinsic value based on your customized inputs.
- Scenario Testing: Develop various forecast scenarios to evaluate different valuation possibilities.
- User-Friendly Design: Intuitive, organized, and crafted for both professionals and newcomers.
How It Works
- Step 1: Download the Excel file.
- Step 2: Review pre-entered Rallybio Corporation (RLYB) data (historical and projected).
- Step 3: Adjust key assumptions (yellow cells) based on your analysis.
- Step 4: View automatic recalculations for Rallybio Corporation’s intrinsic value.
- Step 5: Use the outputs for investment decisions or reporting.
Why Choose This Calculator for Rallybio Corporation (RLYB)?
- Comprehensive Tool: Integrates DCF, WACC, and various financial ratio analyses in one convenient package.
- Customizable Inputs: Modify yellow-highlighted cells to explore different financial scenarios.
- Detailed Insights: Automatically computes Rallybio's intrinsic value and Net Present Value.
- Preloaded Data: Historical and projected data provide accurate and reliable starting points.
- Professional Quality: Perfect for financial analysts, investors, and business consultants focused on Rallybio Corporation (RLYB).
Who Should Use Rallybio Corporation (RLYB)?
- Investors: Make informed investment choices with insights from a leading biotechnology firm.
- Biotech Analysts: Utilize comprehensive data to streamline your research and analysis.
- Healthcare Consultants: Adapt findings for client strategies or market assessments efficiently.
- Biotech Enthusiasts: Enhance your knowledge of biopharmaceutical innovations and market trends.
- Educators and Students: Leverage real-world case studies for learning in biotechnology and finance courses.
What the Template Contains
- Pre-Filled Data: Contains Rallybio Corporation's (RLYB) historical financials and projections.
- Discounted Cash Flow Model: An editable DCF valuation model with automated calculations.
- Weighted Average Cost of Capital (WACC): A specific sheet for calculating WACC using custom inputs.
- Key Financial Ratios: Assess Rallybio Corporation's profitability, efficiency, and leverage.
- Customizable Inputs: Easily modify revenue growth, margins, and tax rates.
- Clear Dashboard: Visuals and tables summarizing essential valuation findings.
Disclaimer
All information, articles, and product details provided on this website are for general informational and educational purposes only. We do not claim any ownership over, nor do we intend to infringe upon, any trademarks, copyrights, logos, brand names, or other intellectual property mentioned or depicted on this site. Such intellectual property remains the property of its respective owners, and any references here are made solely for identification or informational purposes, without implying any affiliation, endorsement, or partnership.
We make no representations or warranties, express or implied, regarding the accuracy, completeness, or suitability of any content or products presented. Nothing on this website should be construed as legal, tax, investment, financial, medical, or other professional advice. In addition, no part of this site—including articles or product references—constitutes a solicitation, recommendation, endorsement, advertisement, or offer to buy or sell any securities, franchises, or other financial instruments, particularly in jurisdictions where such activity would be unlawful.
All content is of a general nature and may not address the specific circumstances of any individual or entity. It is not a substitute for professional advice or services. Any actions you take based on the information provided here are strictly at your own risk. You accept full responsibility for any decisions or outcomes arising from your use of this website and agree to release us from any liability in connection with your use of, or reliance upon, the content or products found herein.