
|
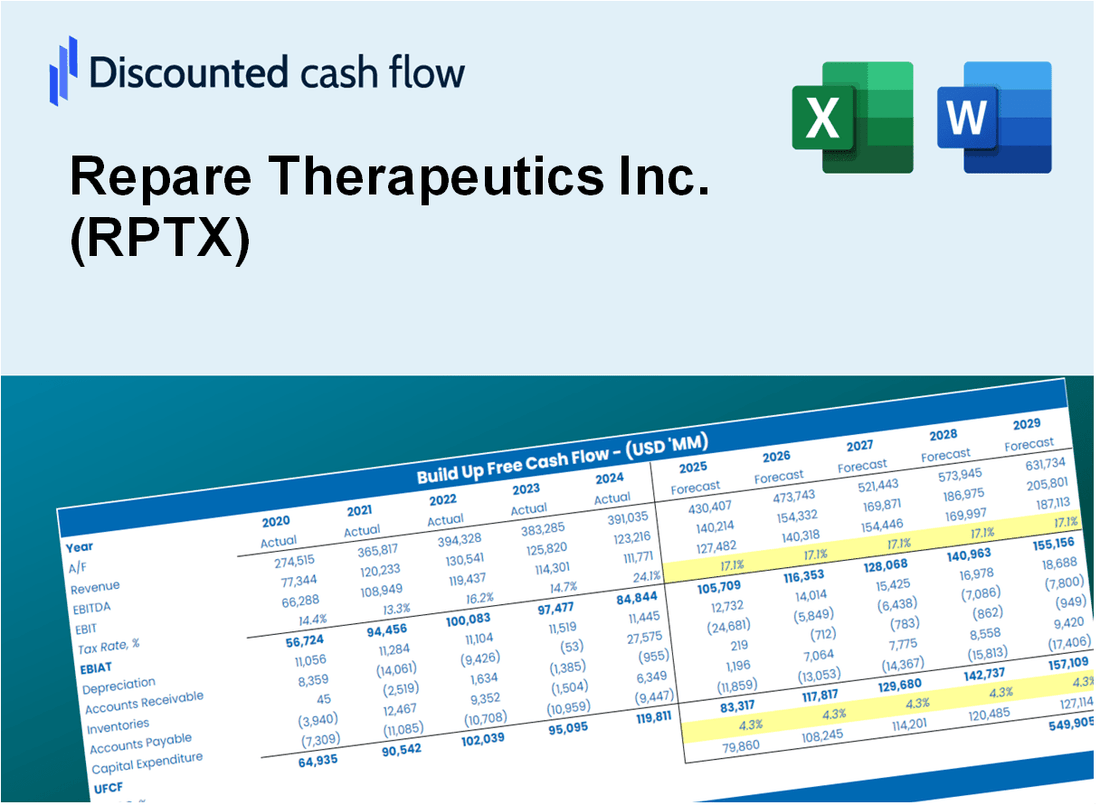
Repare Therapeutics Inc. (RPTX) DCF -Bewertung |
Fully Editable: Tailor To Your Needs In Excel Or Sheets
Professional Design: Trusted, Industry-Standard Templates
Investor-Approved Valuation Models
MAC/PC Compatible, Fully Unlocked
No Expertise Is Needed; Easy To Follow
Repare Therapeutics Inc. (RPTX) Bundle
Evaluieren Sie Repare Therapeutics Inc. (RPTX) finanzielle Aussichten wie ein Experte! Dieser (RPTX) DCF-Taschenrechner bietet Ihnen vorgefüllte Finanzdaten und Gesamtflexibilität, um das Umsatzwachstum, WACC, Margen und andere wesentliche Annahmen zu ändern, um sich an Ihren Projektionen anzupassen.
What You Will Get
- Real RPTX Financial Data: Pre-filled with Repare Therapeutics Inc.’s historical and projected data for precise analysis.
- Fully Editable Template: Modify key inputs like revenue growth, WACC, and EBITDA % with ease.
- Automatic Calculations: See Repare Therapeutics Inc.’s intrinsic value update instantly based on your changes.
- Professional Valuation Tool: Designed for investors, analysts, and consultants seeking accurate DCF results.
- User-Friendly Design: Simple structure and clear instructions for all experience levels.
Key Features
- Comprehensive Data: Repare Therapeutics Inc.'s (RPTX) historical financial reports and pre-filled projections.
- Customizable Inputs: Modify WACC, tax rates, revenue growth, and EBITDA margins as needed.
- Real-Time Insights: Observe Repare's intrinsic value recalculating instantly.
- Intuitive Visual Outputs: Dashboard graphs showcase valuation results and essential metrics.
- Designed for Precision: A professional-grade tool tailored for analysts, investors, and finance professionals.
How It Works
- Step 1: Download the Excel file.
- Step 2: Review pre-entered Repare Therapeutics data (historical and projected).
- Step 3: Adjust key assumptions (yellow cells) based on your analysis.
- Step 4: View automatic recalculations for Repare Therapeutics’ intrinsic value.
- Step 5: Use the outputs for investment decisions or reporting.
Why Choose This Calculator for Repare Therapeutics Inc. (RPTX)?
- Designed for Industry Experts: A sophisticated tool tailored for analysts, investors, and biotech professionals.
- Comprehensive Data: Repare Therapeutics’ historical and projected financials preloaded for precision.
- Flexible Scenario Analysis: Easily simulate various forecasts and assumptions to assess different outcomes.
- Insightful Outputs: Automatically calculates intrinsic value, NPV, and essential financial metrics.
- User-Friendly Interface: Step-by-step guidance ensures a smooth and efficient calculation process.
Who Should Use This Product?
- Biotech Students: Explore drug development processes and apply them using real-world data on Repare Therapeutics Inc. (RPTX).
- Researchers: Integrate cutting-edge models into your studies or publications related to cancer therapies.
- Investors: Validate your investment strategies and assess the potential of Repare Therapeutics Inc. (RPTX) in the biotech market.
- Market Analysts: Optimize your analysis with a tailored, user-friendly model for evaluating biotech companies.
- Healthcare Professionals: Understand how innovative companies like Repare Therapeutics Inc. (RPTX) are assessed in the industry.
What the Template Contains
- Pre-Filled Data: Includes Repare Therapeutics Inc.'s historical financials and projections.
- Discounted Cash Flow Model: Editable DCF valuation model with automated calculations.
- Weighted Average Cost of Capital (WACC): A dedicated sheet for calculating WACC based on user-defined inputs.
- Key Financial Ratios: Evaluate Repare Therapeutics Inc.'s profitability, efficiency, and leverage.
- Customizable Inputs: Easily modify revenue growth, profit margins, and tax rates.
- Clear Dashboard: Visual representations and tables summarizing essential valuation outcomes.
Disclaimer
All information, articles, and product details provided on this website are for general informational and educational purposes only. We do not claim any ownership over, nor do we intend to infringe upon, any trademarks, copyrights, logos, brand names, or other intellectual property mentioned or depicted on this site. Such intellectual property remains the property of its respective owners, and any references here are made solely for identification or informational purposes, without implying any affiliation, endorsement, or partnership.
We make no representations or warranties, express or implied, regarding the accuracy, completeness, or suitability of any content or products presented. Nothing on this website should be construed as legal, tax, investment, financial, medical, or other professional advice. In addition, no part of this site—including articles or product references—constitutes a solicitation, recommendation, endorsement, advertisement, or offer to buy or sell any securities, franchises, or other financial instruments, particularly in jurisdictions where such activity would be unlawful.
All content is of a general nature and may not address the specific circumstances of any individual or entity. It is not a substitute for professional advice or services. Any actions you take based on the information provided here are strictly at your own risk. You accept full responsibility for any decisions or outcomes arising from your use of this website and agree to release us from any liability in connection with your use of, or reliance upon, the content or products found herein.