
|
Rolls-Royce Holdings Plc (RR.L) DCF-Bewertung |
Fully Editable: Tailor To Your Needs In Excel Or Sheets
Professional Design: Trusted, Industry-Standard Templates
Investor-Approved Valuation Models
MAC/PC Compatible, Fully Unlocked
No Expertise Is Needed; Easy To Follow
Rolls-Royce Holdings plc (RR.L) Bundle
Unabhängig davon, ob Sie ein Investor oder Analyst sind, ist dieser Rolls-Royce Holdings Plc (RRL) DCF-Taschenrechner Ihre Anlaufstelle für eine genaue Bewertung. Mit echten Daten von Rolls-Royce Holdings Plc, können Sie Prognosen anpassen und die Auswirkungen sofort beobachten.
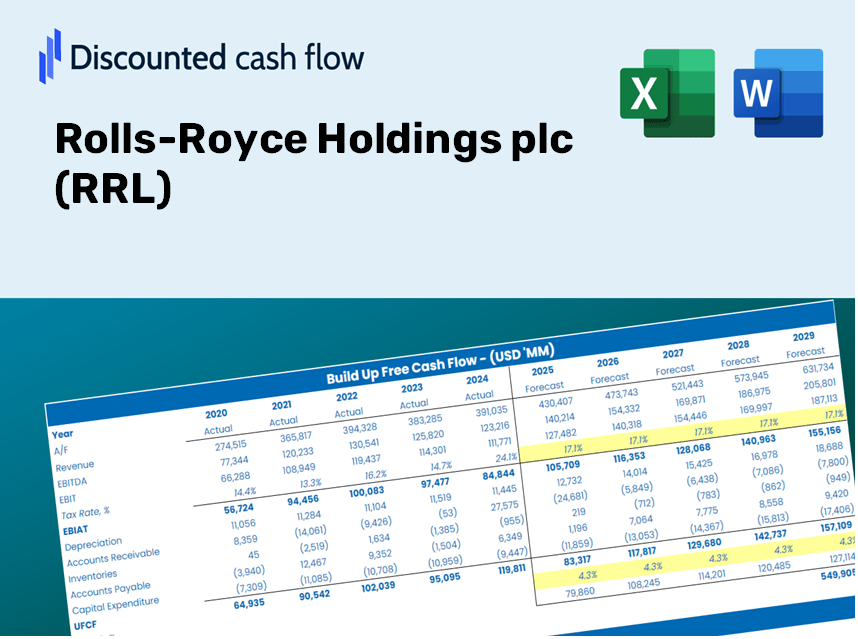
Discounted Cash Flow (DCF) - (USD MM)
| Year | AY1 2020 |
AY2 2021 |
AY3 2022 |
AY4 2023 |
AY5 2024 |
FY1 2025 |
FY2 2026 |
FY3 2027 |
FY4 2028 |
FY5 2029 |
|---|---|---|---|---|---|---|---|---|---|---|
| Revenue | 11,491.0 | 11,218.0 | 13,520.0 | 16,486.0 | 18,909.0 | 21,498.6 | 24,442.8 | 27,790.3 | 31,596.1 | 35,923.2 |
| Revenue Growth, % | 0 | -2.38 | 20.52 | 21.94 | 14.7 | 13.7 | 13.7 | 13.7 | 13.7 | 13.7 |
| EBITDA | 222.0 | 996.0 | 1,253.0 | 3,744.0 | 3,483.0 | 2,631.8 | 2,992.2 | 3,402.0 | 3,867.9 | 4,397.6 |
| EBITDA, % | 1.93 | 8.88 | 9.27 | 22.71 | 18.42 | 12.24 | 12.24 | 12.24 | 12.24 | 12.24 |
| Depreciation | 604.0 | 531.0 | 498.0 | 948.0 | 887.0 | 1,036.9 | 1,178.8 | 1,340.3 | 1,523.8 | 1,732.5 |
| Depreciation, % | 5.26 | 4.73 | 3.68 | 5.75 | 4.69 | 4.82 | 4.82 | 4.82 | 4.82 | 4.82 |
| EBIT | -382.0 | 465.0 | 755.0 | 2,796.0 | 2,596.0 | 1,594.9 | 1,813.4 | 2,061.7 | 2,344.0 | 2,665.1 |
| EBIT, % | -3.32 | 4.15 | 5.58 | 16.96 | 13.73 | 7.42 | 7.42 | 7.42 | 7.42 | 7.42 |
| Total Cash | 3,309.0 | 2,553.0 | 2,395.0 | 3,515.0 | 5,362.0 | 5,114.4 | 5,814.8 | 6,611.1 | 7,516.5 | 8,545.9 |
| Total Cash, percent | .0 | .0 | .0 | .0 | .0 | .0 | .0 | .0 | .0 | .0 |
| Account Receivables | 3,989.0 | 3,666.0 | 3,900.0 | 6,622.0 | 7,588.0 | 7,590.6 | 8,630.1 | 9,812.0 | 11,155.7 | 12,683.5 |
| Account Receivables, % | 34.71 | 32.68 | 28.85 | 40.17 | 40.13 | 35.31 | 35.31 | 35.31 | 35.31 | 35.31 |
| Inventories | 3,690.0 | 3,666.0 | 4,708.0 | 4,848.0 | 5,092.0 | 6,705.4 | 7,623.7 | 8,667.8 | 9,854.8 | 11,204.5 |
| Inventories, % | 32.11 | 32.68 | 34.82 | 29.41 | 26.93 | 31.19 | 31.19 | 31.19 | 31.19 | 31.19 |
| Accounts Payable | 1,418.0 | 1,272.0 | 1,735.0 | 1,608.0 | 1,526.0 | 2,336.3 | 2,656.2 | 3,020.0 | 3,433.6 | 3,903.8 |
| Accounts Payable, % | 12.34 | 11.34 | 12.83 | 9.75 | 8.07 | 10.87 | 10.87 | 10.87 | 10.87 | 10.87 |
| Capital Expenditure | -950.0 | -559.0 | -596.0 | -713.0 | -886.0 | -1,146.7 | -1,303.7 | -1,482.3 | -1,685.3 | -1,916.1 |
| Capital Expenditure, % | -8.27 | -4.98 | -4.41 | -4.32 | -4.69 | -5.33 | -5.33 | -5.33 | -5.33 | -5.33 |
| Tax Rate, % | -12.85 | -12.85 | -12.85 | -12.85 | -12.85 | -12.85 | -12.85 | -12.85 | -12.85 | -12.85 |
| EBITAT | -432.5 | -189.8 | 637.9 | 2,778.7 | 2,929.5 | 1,224.5 | 1,392.2 | 1,582.8 | 1,799.6 | 2,046.1 |
| Depreciation | ||||||||||
| Changes in Account Receivables | ||||||||||
| Changes in Inventories | ||||||||||
| Changes in Accounts Payable | ||||||||||
| Capital Expenditure | ||||||||||
| UFCF | -7,039.5 | -16.8 | -273.1 | 24.7 | 1,638.5 | 309.0 | -370.6 | -421.3 | -479.0 | -544.6 |
| WACC, % | 9.3 | 8.93 | 9.24 | 9.3 | 9.3 | 9.22 | 9.22 | 9.22 | 9.22 | 9.22 |
| PV UFCF | ||||||||||
| SUM PV UFCF | -1,038.4 | |||||||||
| Long Term Growth Rate, % | 3.50 | |||||||||
| Free cash flow (T + 1) | -564 | |||||||||
| Terminal Value | -9,862 | |||||||||
| Present Terminal Value | -6,347 | |||||||||
| Enterprise Value | -7,385 | |||||||||
| Net Debt | -195 | |||||||||
| Equity Value | -7,190 | |||||||||
| Diluted Shares Outstanding, MM | 8,439 | |||||||||
| Equity Value Per Share | -85.20 |
Benefits You Will Receive
- Authentic RRL Financial Data: Pre-loaded with historical and projected figures for Rolls-Royce Holdings plc, ensuring accurate analysis.
- Completely Customizable Template: Effortlessly adjust essential inputs such as revenue growth, WACC, and EBITDA percentage.
- Instant Calculations: Watch the intrinsic value of Rolls-Royce Holdings plc update in real-time as you make adjustments.
- Professional Valuation Tool: Tailored for investors, analysts, and consultants who seek precise DCF results.
- Intuitive Design: Clear layout and straightforward instructions suitable for all levels of experience.
Key Features
- Real-Time RRL Data: Pre-loaded with Rolls-Royce's historical financial performance and future projections.
- Customizable Assumptions: Tailor revenue growth, profit margins, WACC, tax rates, and capital expenditures according to your analysis.
- Dynamic Valuation Framework: Automatic recalculations of Net Present Value (NPV) and intrinsic value reflecting your inputs.
- Scenario Analysis: Generate various forecasting scenarios to evaluate different valuation results.
- User-Friendly Interface: Intuitive design, structured for both professionals and newcomers in finance.
How It Works
- 1. Access the Template: Download and open the Excel file containing Rolls-Royce's preloaded data.
- 2. Modify Assumptions: Adjust key metrics such as growth projections, WACC, and capital expenditures.
- 3. Analyze Results Immediately: The DCF model automatically computes intrinsic value and NPV.
- 4. Experiment with Scenarios: Evaluate various forecasts to examine different valuation results.
- 5. Utilize with Assurance: Deliver expert valuation insights to reinforce your decision-making.
Why Choose This Calculator for Rolls-Royce Holdings plc (RRL)?
- All-in-One Solution: Combines DCF, WACC, and financial ratio assessments for a holistic analysis.
- Flexible Inputs: Modify the yellow-highlighted cells to explore diverse financial scenarios.
- In-Depth Analysis: Automatically computes the intrinsic value and Net Present Value for Rolls-Royce Holdings plc (RRL).
- Preloaded Metrics: Historical and projected data provide accurate benchmarks for analysis.
- High-Caliber Tool: Perfect for financial analysts, investors, and business consultants engaged with Rolls-Royce Holdings plc (RRL).
Who Can Benefit from Rolls-Royce Holdings plc (RRL)?
- Investors: Make informed choices with a reliable analysis tool tailored for the aerospace sector.
- Financial Analysts: Streamline your workflow with a customizable financial model designed for Rolls-Royce Holdings plc (RRL).
- Consultants: Effortlessly modify templates for client presentations focused on aviation and engineering.
- Aerospace Enthusiasts: Enhance your knowledge of industry valuation methods through practical applications.
- Educators and Students: Leverage it as a hands-on educational resource in aerospace and finance programs.
Overview of Template Components
- Operating and Balance Sheet Data: Pre-filled historical data and forecasts for Rolls-Royce Holdings plc (RRL), including revenue, EBITDA, EBIT, and capital expenditures.
- WACC Calculation: A specific sheet dedicated to the Weighted Average Cost of Capital (WACC), featuring parameters such as Beta, risk-free rate, and share price.
- DCF Valuation (Unlevered and Levered): Customizable Discounted Cash Flow models that display intrinsic value along with comprehensive calculations.
- Financial Statements: Pre-loaded financial statements (annual and quarterly) to facilitate thorough analysis.
- Key Ratios: Includes profitability, leverage, and efficiency ratios specific to Rolls-Royce Holdings plc (RRL).
- Dashboard and Charts: Visual overview of valuation outputs and assumptions to simplify results analysis.
Disclaimer
All information, articles, and product details provided on this website are for general informational and educational purposes only. We do not claim any ownership over, nor do we intend to infringe upon, any trademarks, copyrights, logos, brand names, or other intellectual property mentioned or depicted on this site. Such intellectual property remains the property of its respective owners, and any references here are made solely for identification or informational purposes, without implying any affiliation, endorsement, or partnership.
We make no representations or warranties, express or implied, regarding the accuracy, completeness, or suitability of any content or products presented. Nothing on this website should be construed as legal, tax, investment, financial, medical, or other professional advice. In addition, no part of this site—including articles or product references—constitutes a solicitation, recommendation, endorsement, advertisement, or offer to buy or sell any securities, franchises, or other financial instruments, particularly in jurisdictions where such activity would be unlawful.
All content is of a general nature and may not address the specific circumstances of any individual or entity. It is not a substitute for professional advice or services. Any actions you take based on the information provided here are strictly at your own risk. You accept full responsibility for any decisions or outcomes arising from your use of this website and agree to release us from any liability in connection with your use of, or reliance upon, the content or products found herein.