
|
Revolution Medicines, Inc. (RVMD) DCF -Bewertung |
Fully Editable: Tailor To Your Needs In Excel Or Sheets
Professional Design: Trusted, Industry-Standard Templates
Investor-Approved Valuation Models
MAC/PC Compatible, Fully Unlocked
No Expertise Is Needed; Easy To Follow
Revolution Medicines, Inc. (RVMD) Bundle
Entdecken Sie das wahre Potenzial von Revolution Medicines, Inc. (RVMD) mit unserem fortschrittlichen DCF -Taschenrechner! Passen Sie die wichtigsten Annahmen an, erkunden Sie verschiedene Szenarien und beurteilen Sie, wie sich Änderungen auf die Bewertung von Revolution Medicines, Inc. (RVMD) auswirken - alles innerhalb einer einzigen Excel -Vorlage.
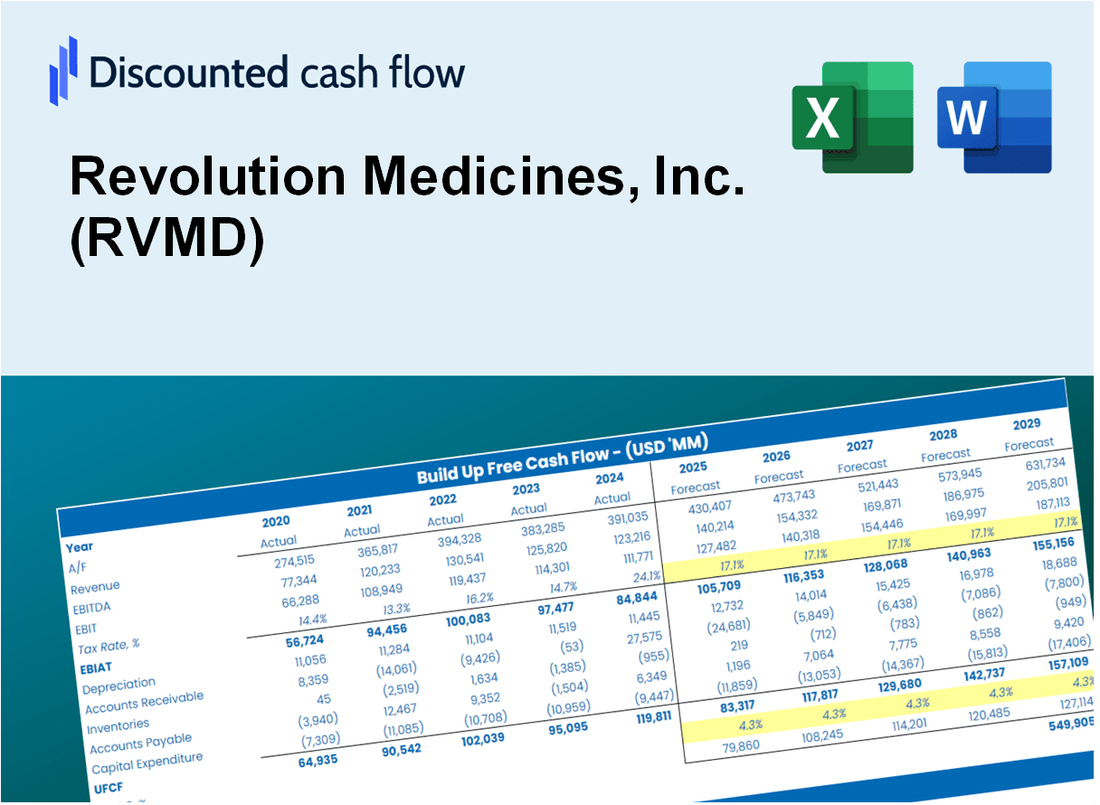
Discounted Cash Flow (DCF) - (USD MM)
| Year | AY1 2020 |
AY2 2021 |
AY3 2022 |
AY4 2023 |
AY5 2024 |
FY1 2025 |
FY2 2026 |
FY3 2027 |
FY4 2028 |
FY5 2029 |
|---|---|---|---|---|---|---|---|---|---|---|
| Revenue | 43.0 | 29.4 | 35.4 | 11.6 | .0 | .0 | .0 | .0 | .0 | .0 |
| Revenue Growth, % | 0 | -31.62 | 20.38 | -67.27 | -100 | -44.63 | -44.63 | -44.63 | -44.63 | -44.63 |
| EBITDA | -101.9 | -179.7 | -248.6 | -456.7 | -589.0 | .0 | .0 | .0 | .0 | .0 |
| EBITDA, % | -237.1 | -611.59 | -702.72 | -3943.65 | 100 | -60 | -60 | -60 | -60 | -60 |
| Depreciation | 6.5 | 7.3 | 9.7 | 5.0 | 11.8 | .0 | .0 | .0 | .0 | .0 |
| Depreciation, % | 15.23 | 24.95 | 27.29 | 43.26 | 100 | 42.15 | 42.15 | 42.15 | 42.15 | 42.15 |
| EBIT | -108.5 | -187.1 | -258.3 | -461.7 | -600.8 | .0 | .0 | .0 | .0 | .0 |
| EBIT, % | -252.33 | -636.54 | -730.01 | -3986.92 | 100 | -60 | -60 | -60 | -60 | -60 |
| Total Cash | 440.7 | 577.1 | 644.9 | 1,853.0 | 2,289.3 | .0 | .0 | .0 | .0 | .0 |
| Total Cash, percent | .0 | .0 | .0 | .0 | .0 | .0 | .0 | .0 | .0 | .0 |
| Account Receivables | 6.4 | 5.9 | 4.7 | 1.3 | .0 | .0 | .0 | .0 | .0 | .0 |
| Account Receivables, % | 14.87 | 20.17 | 13.21 | 10.83 | 100 | 31.82 | 31.82 | 31.82 | 31.82 | 31.82 |
| Inventories | .0 | .0 | .0 | .0 | .0 | .0 | .0 | .0 | .0 | .0 |
| Inventories, % | 0 | 0 | 0 | 0 | 100 | 20 | 20 | 20 | 20 | 20 |
| Accounts Payable | 12.6 | 14.1 | 21.3 | 61.8 | 54.4 | .0 | .0 | .0 | .0 | .0 |
| Accounts Payable, % | 29.33 | 47.83 | 60.22 | 533.58 | 100 | 67.48 | 67.48 | 67.48 | 67.48 | 67.48 |
| Capital Expenditure | -2.9 | -6.5 | -10.8 | -7.7 | -10.3 | .0 | .0 | .0 | .0 | .0 |
| Capital Expenditure, % | -6.82 | -22.21 | -30.57 | -66.74 | 100 | -25.27 | -25.27 | -25.27 | -25.27 | -25.27 |
| Tax Rate, % | 0.12532 | 0.12532 | 0.12532 | 0.12532 | 0.12532 | 0.12532 | 0.12532 | 0.12532 | 0.12532 | 0.12532 |
| EBITAT | -108.1 | -187.1 | -257.8 | -458.0 | -600.1 | .0 | .0 | .0 | .0 | .0 |
| Depreciation | ||||||||||
| Changes in Account Receivables | ||||||||||
| Changes in Inventories | ||||||||||
| Changes in Accounts Payable | ||||||||||
| Capital Expenditure | ||||||||||
| UFCF | -98.3 | -184.4 | -250.5 | -416.8 | -604.7 | -54.4 | .0 | .0 | .0 | .0 |
| WACC, % | 8.35 | 8.35 | 8.35 | 8.35 | 8.35 | 8.35 | 8.35 | 8.35 | 8.35 | 8.35 |
| PV UFCF | ||||||||||
| SUM PV UFCF | -50.2 | |||||||||
| Long Term Growth Rate, % | 2.00 | |||||||||
| Free cash flow (T + 1) | 0 | |||||||||
| Terminal Value | 0 | |||||||||
| Present Terminal Value | 0 | |||||||||
| Enterprise Value | -50 | |||||||||
| Net Debt | -407 | |||||||||
| Equity Value | 357 | |||||||||
| Diluted Shares Outstanding, MM | 168 | |||||||||
| Equity Value Per Share | 2.13 |
What You Will Receive
- Customizable Excel Template: A fully editable Excel-based DCF Calculator featuring pre-filled financials for Revolution Medicines, Inc. (RVMD).
- Real-Time Data: Historical financial data and forward-looking projections (highlighted in the yellow cells).
- Assumption Flexibility: Modify assumptions such as revenue growth, EBITDA %, and WACC to suit your analysis.
- Instant Calculations: Quickly observe how your inputs affect the valuation of Revolution Medicines, Inc. (RVMD).
- Professional Resource: Designed for investors, CFOs, consultants, and financial analysts.
- Intuitive Layout: Organized for simplicity and user-friendliness, complete with detailed instructions.
Key Features
- Comprehensive DCF Calculator: Offers detailed unlevered and levered DCF valuation models tailored for Revolution Medicines, Inc. (RVMD).
- WACC Calculator: Features a pre-built Weighted Average Cost of Capital sheet with adjustable inputs specific to RVMD.
- Customizable Forecast Assumptions: Adjust growth rates, capital expenditures, and discount rates to fit Revolution Medicines' projections.
- Integrated Financial Ratios: Evaluate profitability, leverage, and efficiency ratios relevant to Revolution Medicines, Inc. (RVMD).
- Interactive Dashboard and Charts: Visual representations summarize essential valuation metrics for straightforward analysis.
How It Works
- Step 1: Download the Excel file for Revolution Medicines, Inc. (RVMD).
- Step 2: Review the pre-filled financial data and forecasts for Revolution Medicines, Inc. (RVMD).
- Step 3: Adjust key inputs such as revenue growth, WACC, and tax rates (highlighted cells) for Revolution Medicines, Inc. (RVMD).
- Step 4: Observe the DCF model update in real-time as you modify your assumptions for Revolution Medicines, Inc. (RVMD).
- Step 5: Evaluate the outputs and utilize the results for your investment decisions regarding Revolution Medicines, Inc. (RVMD).
Why Choose the Revolution Medicines, Inc. (RVMD) Calculator?
- Accuracy: Utilizes real Revolution Medicines financial data for precise calculations.
- Flexibility: Allows users to easily experiment and adjust inputs as needed.
- Time-Saving: Eliminate the complexity of creating a DCF model from the ground up.
- Professional-Grade: Crafted with the expertise and usability expected at the CFO level.
- User-Friendly: Intuitive design makes it accessible for users with varying levels of financial modeling knowledge.
Who Should Use This Product?
- Investors: Evaluate Revolution Medicines, Inc. (RVMD) to inform stock trading decisions.
- CFOs and Financial Analysts: Optimize valuation methodologies and validate financial forecasts.
- Biotech Entrepreneurs: Understand the valuation strategies of established biotech firms like Revolution Medicines.
- Consultants: Provide comprehensive valuation analyses for clients in the biotech sector.
- Students and Educators: Utilize current market data to explore and teach valuation concepts.
What the Template Contains
- Comprehensive DCF Model: Editable template featuring detailed valuation calculations tailored for Revolution Medicines, Inc. (RVMD).
- Real-World Data: Revolution Medicines' historical and projected financials preloaded for in-depth analysis.
- Customizable Parameters: Modify WACC, growth rates, and tax assumptions to explore various scenarios.
- Financial Statements: Complete annual and quarterly breakdowns for enhanced insights into the company's performance.
- Key Ratios: Integrated analysis for profitability, efficiency, and leverage specific to Revolution Medicines, Inc. (RVMD).
- Dashboard with Visual Outputs: Interactive charts and tables providing clear, actionable results for stakeholders.
Disclaimer
All information, articles, and product details provided on this website are for general informational and educational purposes only. We do not claim any ownership over, nor do we intend to infringe upon, any trademarks, copyrights, logos, brand names, or other intellectual property mentioned or depicted on this site. Such intellectual property remains the property of its respective owners, and any references here are made solely for identification or informational purposes, without implying any affiliation, endorsement, or partnership.
We make no representations or warranties, express or implied, regarding the accuracy, completeness, or suitability of any content or products presented. Nothing on this website should be construed as legal, tax, investment, financial, medical, or other professional advice. In addition, no part of this site—including articles or product references—constitutes a solicitation, recommendation, endorsement, advertisement, or offer to buy or sell any securities, franchises, or other financial instruments, particularly in jurisdictions where such activity would be unlawful.
All content is of a general nature and may not address the specific circumstances of any individual or entity. It is not a substitute for professional advice or services. Any actions you take based on the information provided here are strictly at your own risk. You accept full responsibility for any decisions or outcomes arising from your use of this website and agree to release us from any liability in connection with your use of, or reliance upon, the content or products found herein.