
|
Recursion Pharmaceuticals, Inc. (RXRX) DCF -Bewertung |
Fully Editable: Tailor To Your Needs In Excel Or Sheets
Professional Design: Trusted, Industry-Standard Templates
Investor-Approved Valuation Models
MAC/PC Compatible, Fully Unlocked
No Expertise Is Needed; Easy To Follow
Recursion Pharmaceuticals, Inc. (RXRX) Bundle
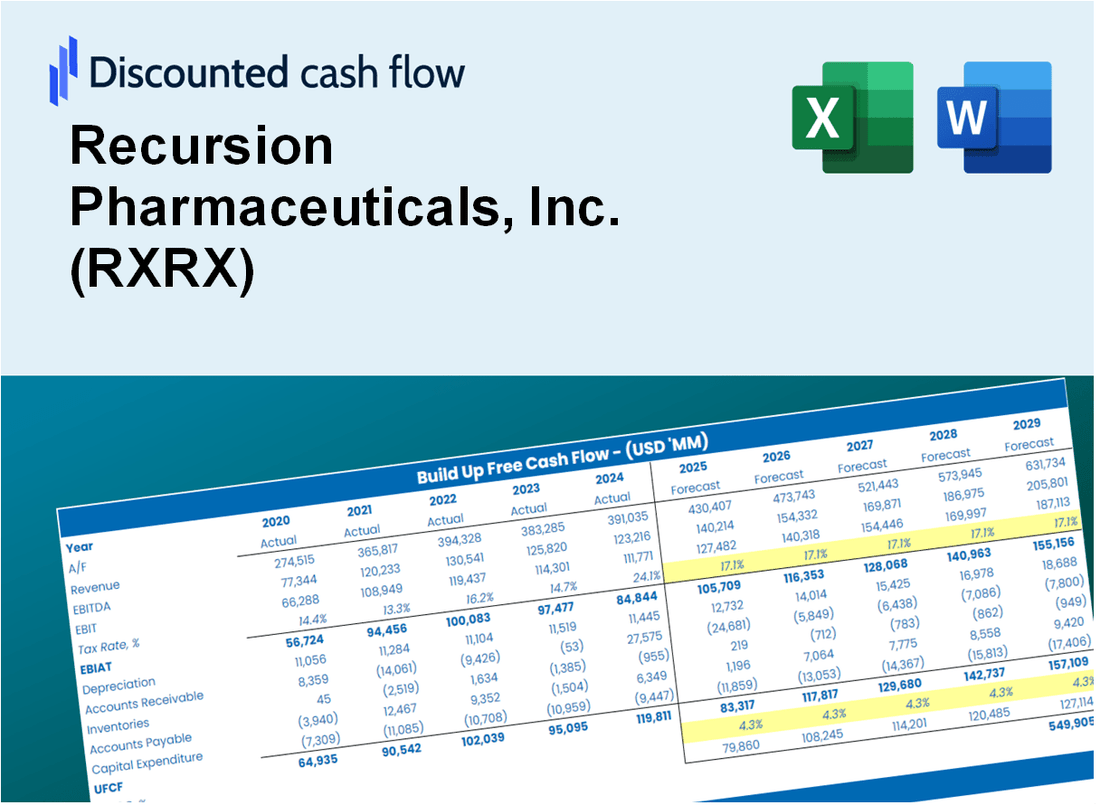
Vereinfachen Sie die Bewertung von Recursion Pharmaceuticals, Inc. (RXRX) mit diesem anpassbaren DCF -Taschenrechner! Mit Real Recursion Pharmaceuticals, Inc. (RXRX) Finanzdaten und einstellbaren Prognoseeingaben können Sie Szenarien testen und Recursion Pharmaceuticals, Inc. (RXRX) in Minuten aufdecken.
Discounted Cash Flow (DCF) - (USD MM)
| Year | AY1 2020 |
AY2 2021 |
AY3 2022 |
AY4 2023 |
AY5 2024 |
FY1 2025 |
FY2 2026 |
FY3 2027 |
FY4 2028 |
FY5 2029 |
|---|---|---|---|---|---|---|---|---|---|---|
| Revenue | 3.4 | 10.0 | 39.7 | 43.9 | 58.8 | 94.8 | 152.8 | 246.3 | 397.0 | 639.8 |
| Revenue Growth, % | 0 | 193 | 296.81 | 10.57 | 34.1 | 61.17 | 61.17 | 61.17 | 61.17 | 61.17 |
| EBITDA | -81.7 | -175.1 | -227.7 | -307.6 | -426.7 | -94.8 | -152.8 | -246.3 | -397.0 | -639.8 |
| EBITDA, % | -2393.88 | -1751.22 | -573.74 | -701.13 | -725.24 | -100 | -100 | -100 | -100 | -100 |
| Depreciation | 3.9 | 8.4 | 11.8 | 24.4 | 36.5 | 62.8 | 101.3 | 163.2 | 263.1 | 424.0 |
| Depreciation, % | 115.53 | 84.05 | 29.63 | 55.62 | 62.02 | 66.26 | 66.26 | 66.26 | 66.26 | 66.26 |
| EBIT | -85.6 | -183.5 | -239.4 | -332.0 | -463.2 | -94.8 | -152.8 | -246.3 | -397.0 | -639.8 |
| EBIT, % | -2509.41 | -1835.27 | -603.36 | -756.75 | -787.26 | -100 | -100 | -100 | -100 | -100 |
| Total Cash | 262.1 | 516.6 | 549.9 | 391.6 | 594.4 | 94.8 | 152.8 | 246.3 | 397.0 | 639.8 |
| Total Cash, percent | .0 | .0 | .0 | .0 | .0 | .0 | .0 | .0 | .0 | .0 |
| Account Receivables | .2 | 9.1 | 2.8 | 3.1 | 49.2 | 36.6 | 59.0 | 95.1 | 153.3 | 247.0 |
| Account Receivables, % | 4.57 | 90.9 | 6.94 | 7.05 | 83.56 | 38.6 | 38.6 | 38.6 | 38.6 | 38.6 |
| Inventories | .0 | .0 | .0 | .0 | .0 | .0 | .0 | .0 | .0 | .0 |
| Inventories, % | 0 | 0 | 0 | 0 | 0 | 0 | 0 | 0 | 0 | 0 |
| Accounts Payable | 1.1 | 2.8 | 4.6 | 4.0 | 21.6 | 22.2 | 35.8 | 57.6 | 92.9 | 149.7 |
| Accounts Payable, % | 31.47 | 28.19 | 11.56 | 9.01 | 36.73 | 23.39 | 23.39 | 23.39 | 23.39 | 23.39 |
| Capital Expenditure | -6.7 | -39.8 | -37.4 | -12.0 | -13.7 | -65.4 | -105.4 | -169.8 | -273.7 | -441.1 |
| Capital Expenditure, % | -197.33 | -397.98 | -94.15 | -27.25 | -23.28 | -68.93 | -68.93 | -68.93 | -68.93 | -68.93 |
| Tax Rate, % | 0.24248 | 0.24248 | 0.24248 | 0.24248 | 0.24248 | 0.24248 | 0.24248 | 0.24248 | 0.24248 | 0.24248 |
| EBITAT | -85.6 | -183.5 | -239.4 | -328.0 | -462.1 | -94.6 | -152.4 | -245.6 | -395.8 | -638.0 |
| Depreciation | ||||||||||
| Changes in Account Receivables | ||||||||||
| Changes in Inventories | ||||||||||
| Changes in Accounts Payable | ||||||||||
| Capital Expenditure | ||||||||||
| UFCF | -87.5 | -222.1 | -256.9 | -316.5 | -467.7 | -84.0 | -165.3 | -266.4 | -429.4 | -692.0 |
| WACC, % | 7.72 | 7.72 | 7.72 | 7.72 | 7.72 | 7.72 | 7.72 | 7.72 | 7.72 | 7.72 |
| PV UFCF | ||||||||||
| SUM PV UFCF | -1,229.5 | |||||||||
| Long Term Growth Rate, % | 2.00 | |||||||||
| Free cash flow (T + 1) | -706 | |||||||||
| Terminal Value | -12,340 | |||||||||
| Present Terminal Value | -8,508 | |||||||||
| Enterprise Value | -9,738 | |||||||||
| Net Debt | -486 | |||||||||
| Equity Value | -9,252 | |||||||||
| Diluted Shares Outstanding, MM | 274 | |||||||||
| Equity Value Per Share | -33.74 |
What You Will Get
- Editable Excel Template: A fully customizable Excel-based DCF Calculator featuring pre-filled real RXRX financials.
- Real-World Data: Historical data and forward-looking estimates (as indicated in the highlighted cells).
- Forecast Flexibility: Adjust forecast assumptions such as revenue growth, EBITDA %, and WACC.
- Automatic Calculations: Instantly observe how your inputs affect Recursion Pharmaceuticals’ valuation.
- Professional Tool: Designed for investors, CFOs, consultants, and financial analysts.
- User-Friendly Design: Organized for clarity and ease of use, complete with step-by-step instructions.
Key Features
- Real-Life RXRX Data: Pre-filled with Recursion Pharmaceuticals' historical financials and forward-looking projections.
- Fully Customizable Inputs: Adjust revenue growth, margins, WACC, tax rates, and capital expenditures to fit your analysis.
- Dynamic Valuation Model: Automatic updates to Net Present Value (NPV) and intrinsic value based on your customized inputs.
- Scenario Testing: Develop multiple forecast scenarios to evaluate various valuation outcomes.
- User-Friendly Design: Intuitive, organized, and crafted for both professionals and newcomers.
How It Works
- Step 1: Download the prebuilt Excel template featuring Recursion Pharmaceuticals, Inc. (RXRX) data.
- Step 2: Navigate through the pre-filled sheets to familiarize yourself with the essential metrics.
- Step 3: Modify forecasts and assumptions in the editable yellow cells (WACC, growth, margins).
- Step 4: Instantly see the recalculated results, including Recursion Pharmaceuticals, Inc.'s (RXRX) intrinsic value.
- Step 5: Utilize the outputs to make informed investment decisions or create comprehensive reports.
Why Choose Recursion Pharmaceuticals (RXRX)?
- Innovative Solutions: Leverage cutting-edge technology to accelerate drug discovery.
- Data-Driven Insights: Utilize advanced analytics to enhance research accuracy and outcomes.
- Collaborative Approach: Work alongside industry leaders to drive meaningful advancements in healthcare.
- Comprehensive Support: Benefit from a dedicated team committed to your project’s success.
- Proven Track Record: Trusted by top-tier organizations for delivering impactful results.
Who Should Use This Product?
- Individual Investors: Gain insights for making informed decisions regarding Recursion Pharmaceuticals (RXRX) stock.
- Financial Analysts: Enhance valuation processes with accessible financial models tailored for Recursion Pharmaceuticals (RXRX).
- Consultants: Provide accurate and timely valuation insights related to Recursion Pharmaceuticals (RXRX) for your clients.
- Business Owners: Learn how biotechnology firms like Recursion Pharmaceuticals (RXRX) are valued to inform your own business strategies.
- Finance Students: Master valuation techniques using real-world data and scenarios from Recursion Pharmaceuticals (RXRX).
What the Template Contains
- Preloaded RXRX Data: Historical and projected financial data, including revenue, EBIT, and capital expenditures.
- DCF and WACC Models: Professional-grade sheets for calculating intrinsic value and Weighted Average Cost of Capital.
- Editable Inputs: Yellow-highlighted cells for adjusting revenue growth, tax rates, and discount rates.
- Financial Statements: Comprehensive annual and quarterly financials for deeper analysis.
- Key Ratios: Profitability, leverage, and efficiency ratios to evaluate performance.
- Dashboard and Charts: Visual summaries of valuation outcomes and assumptions.
Disclaimer
All information, articles, and product details provided on this website are for general informational and educational purposes only. We do not claim any ownership over, nor do we intend to infringe upon, any trademarks, copyrights, logos, brand names, or other intellectual property mentioned or depicted on this site. Such intellectual property remains the property of its respective owners, and any references here are made solely for identification or informational purposes, without implying any affiliation, endorsement, or partnership.
We make no representations or warranties, express or implied, regarding the accuracy, completeness, or suitability of any content or products presented. Nothing on this website should be construed as legal, tax, investment, financial, medical, or other professional advice. In addition, no part of this site—including articles or product references—constitutes a solicitation, recommendation, endorsement, advertisement, or offer to buy or sell any securities, franchises, or other financial instruments, particularly in jurisdictions where such activity would be unlawful.
All content is of a general nature and may not address the specific circumstances of any individual or entity. It is not a substitute for professional advice or services. Any actions you take based on the information provided here are strictly at your own risk. You accept full responsibility for any decisions or outcomes arising from your use of this website and agree to release us from any liability in connection with your use of, or reliance upon, the content or products found herein.