
|
Sicherheitsversicherungsgruppe, Inc. (SAFT) DCF -Bewertung |
Fully Editable: Tailor To Your Needs In Excel Or Sheets
Professional Design: Trusted, Industry-Standard Templates
Investor-Approved Valuation Models
MAC/PC Compatible, Fully Unlocked
No Expertise Is Needed; Easy To Follow
Safety Insurance Group, Inc. (SAFT) Bundle
Unabhängig davon, ob Sie ein Investor oder ein Analyst sind, ist dieser (SAFT) DCF-Taschenrechner Ihre Anlaufstelle für eine genaue Bewertung. Ausgestattet mit realen Daten der Sicherheitsversicherung Group, Inc. können Sie Prognosen anpassen und die Auswirkungen in Echtzeit beobachten.
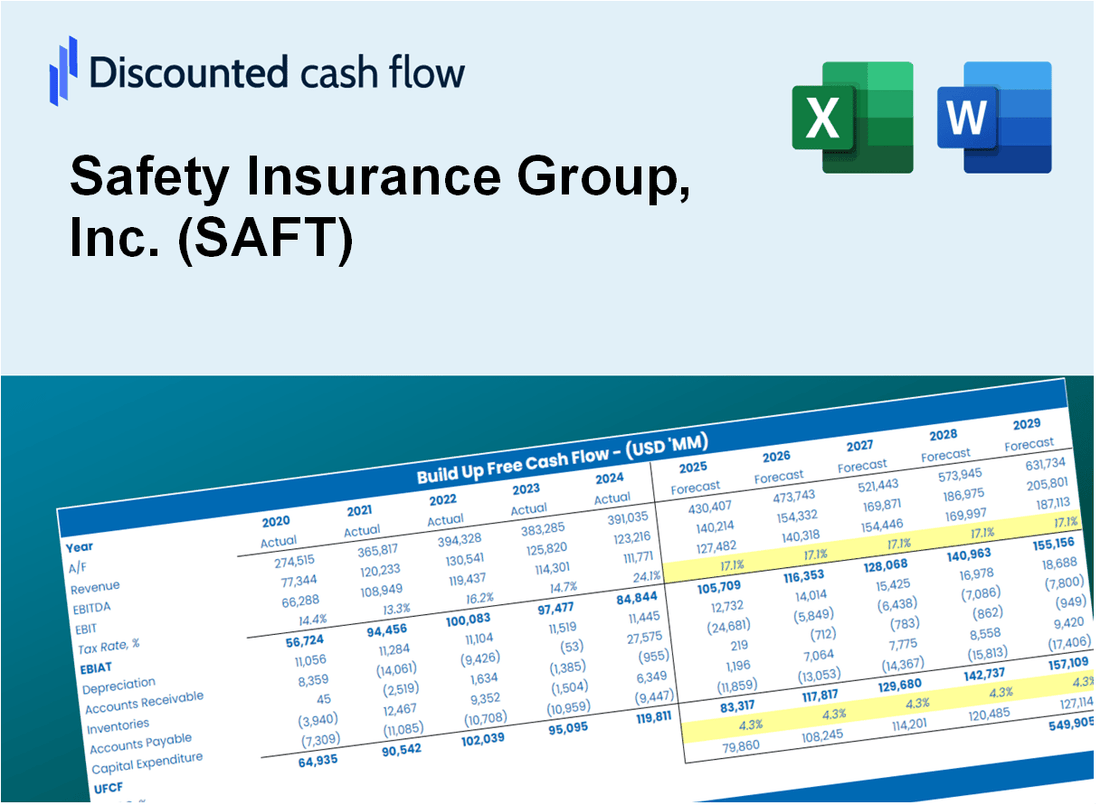
Discounted Cash Flow (DCF) - (USD MM)
| Year | AY1 2020 |
AY2 2021 |
AY3 2022 |
AY4 2023 |
AY5 2024 |
FY1 2025 |
FY2 2026 |
FY3 2027 |
FY4 2028 |
FY5 2029 |
|---|---|---|---|---|---|---|---|---|---|---|
| Revenue | 829.1 | 864.7 | 797.6 | 920.9 | 1,109.7 | 1,199.9 | 1,297.4 | 1,402.9 | 1,516.9 | 1,640.1 |
| Revenue Growth, % | 0 | 4.3 | -7.77 | 15.46 | 20.51 | 8.13 | 8.13 | 8.13 | 8.13 | 8.13 |
| EBITDA | 182.7 | 171.7 | 66.7 | 28.4 | 99.3 | 149.5 | 161.6 | 174.8 | 189.0 | 204.3 |
| EBITDA, % | 22.04 | 19.85 | 8.36 | 3.08 | 8.95 | 12.46 | 12.46 | 12.46 | 12.46 | 12.46 |
| Depreciation | 7.5 | 6.9 | 6.6 | 8.7 | 9.5 | 10.4 | 11.2 | 12.1 | 13.1 | 14.2 |
| Depreciation, % | 0.9079 | 0.79748 | 0.82878 | 0.93999 | 0.8529 | 0.86541 | 0.86541 | 0.86541 | 0.86541 | 0.86541 |
| EBIT | 175.2 | 164.8 | 60.1 | 19.7 | 89.9 | 139.1 | 150.4 | 162.6 | 175.8 | 190.1 |
| EBIT, % | 21.13 | 19.06 | 7.54 | 2.14 | 8.1 | 11.59 | 11.59 | 11.59 | 11.59 | 11.59 |
| Total Cash | 1,310.9 | 1,281.9 | 1,075.5 | 1,090.3 | 59.0 | 972.7 | 1,051.7 | 1,137.2 | 1,229.6 | 1,329.5 |
| Total Cash, percent | .0 | .0 | .0 | .0 | .0 | .0 | .0 | .0 | .0 | .0 |
| Account Receivables | 300.5 | 290.6 | 299.8 | 383.2 | 306.5 | 424.0 | 458.4 | 495.7 | 536.0 | 579.5 |
| Account Receivables, % | 36.24 | 33.61 | 37.59 | 41.61 | 27.62 | 35.33 | 35.33 | 35.33 | 35.33 | 35.33 |
| Inventories | .0 | -298.6 | 14.2 | -900.8 | .0 | -313.4 | -338.8 | -366.4 | -396.1 | -428.3 |
| Inventories, % | 0 | -34.53 | 1.77 | -97.82 | 0 | -26.12 | -26.12 | -26.12 | -26.12 | -26.12 |
| Accounts Payable | 87.7 | 85.8 | 85.3 | 80.2 | 96.4 | 116.6 | 126.1 | 136.3 | 147.4 | 159.4 |
| Accounts Payable, % | 10.58 | 9.92 | 10.7 | 8.71 | 8.68 | 9.72 | 9.72 | 9.72 | 9.72 | 9.72 |
| Capital Expenditure | -9.9 | -8.2 | -2.1 | -1.8 | -4.4 | -7.2 | -7.8 | -8.4 | -9.1 | -9.8 |
| Capital Expenditure, % | -1.2 | -0.95118 | -0.2623 | -0.19362 | -0.39343 | -0.60004 | -0.60004 | -0.60004 | -0.60004 | -0.60004 |
| Tax Rate, % | 21.29 | 21.29 | 21.29 | 21.29 | 21.29 | 21.29 | 21.29 | 21.29 | 21.29 | 21.29 |
| EBITAT | 138.6 | 131.1 | 47.0 | 15.2 | 70.7 | 109.3 | 118.2 | 127.8 | 138.1 | 149.4 |
| Depreciation | ||||||||||
| Changes in Account Receivables | ||||||||||
| Changes in Inventories | ||||||||||
| Changes in Accounts Payable | ||||||||||
| Capital Expenditure | ||||||||||
| UFCF | -76.6 | 436.3 | -270.9 | 848.5 | -732.1 | 328.6 | 122.1 | 132.0 | 142.7 | 154.3 |
| WACC, % | 4.68 | 4.68 | 4.68 | 4.68 | 4.68 | 4.68 | 4.68 | 4.68 | 4.68 | 4.68 |
| PV UFCF | ||||||||||
| SUM PV UFCF | 782.0 | |||||||||
| Long Term Growth Rate, % | 2.00 | |||||||||
| Free cash flow (T + 1) | 157 | |||||||||
| Terminal Value | 5,870 | |||||||||
| Present Terminal Value | 4,669 | |||||||||
| Enterprise Value | 5,451 | |||||||||
| Net Debt | -13 | |||||||||
| Equity Value | 5,465 | |||||||||
| Diluted Shares Outstanding, MM | 15 | |||||||||
| Equity Value Per Share | 371.31 |
What You Will Get
- Pre-Filled Financial Model: Safety Insurance Group’s actual data provides an accurate DCF valuation.
- Full Forecast Control: Modify revenue growth, profit margins, WACC, and other essential metrics.
- Instant Calculations: Real-time updates allow you to see results immediately as adjustments are made.
- Investor-Ready Template: A polished Excel file crafted for professional-level valuation.
- Customizable and Reusable: Designed for adaptability, enabling repeated use for comprehensive forecasts.
Key Features
- Comprehensive Risk Assessment: Access detailed pre-loaded historical data and future risk projections specific to Safety Insurance Group, Inc. (SAFT).
- Tailored Coverage Options: Modify highlighted fields to adjust policy parameters and coverage limits.
- Real-Time Data Analysis: Instant updates to risk metrics, premium calculations, and loss projections.
- User-Friendly Interface: Intuitive charts and summaries designed to help you understand your insurance portfolio.
- Suitable for All Users: A straightforward design catering to both seasoned professionals and those new to insurance.
How It Works
- Step 1: Download the Excel file.
- Step 2: Review Safety Insurance Group, Inc.'s (SAFT) pre-filled financial data and forecasts.
- Step 3: Modify critical inputs like revenue growth, WACC, and tax rates (highlighted cells).
- Step 4: Watch the DCF model update instantly as you tweak assumptions.
- Step 5: Analyze the outputs and use the results for investment decisions.
Why Choose Safety Insurance Group, Inc. (SAFT)?
- Reliability: Trustworthy data sourced from actual Safety Insurance financials.
- Adaptability: Built for users to easily adjust and experiment with inputs.
- Efficiency: Eliminate the need to create a financial model from the ground up.
- Expert-Level: Crafted with the precision and usability expected by industry professionals.
- Intuitive: User-friendly interface suitable for individuals with varying levels of financial expertise.
Who Should Use This Product?
- Insurance Professionals: Develop comprehensive risk assessment models for client portfolios.
- Corporate Risk Management Teams: Evaluate insurance scenarios to inform business decisions.
- Consultants and Advisors: Offer clients precise insights into the valuation of Safety Insurance Group, Inc. (SAFT).
- Students and Educators: Utilize real-world data to learn and teach about the insurance industry.
- Financial Analysts: Gain an understanding of how insurance companies like Safety Insurance Group, Inc. (SAFT) are valued in the market.
What the Template Contains
- Preloaded SAFT Data: Historical and projected financial data, including premiums earned, loss ratios, and operating expenses.
- DCF and WACC Models: Professional-grade sheets for calculating intrinsic value and Weighted Average Cost of Capital.
- Editable Inputs: Yellow-highlighted cells for adjusting premium growth, claims ratios, and discount rates.
- Financial Statements: Comprehensive annual and quarterly financials for deeper analysis.
- Key Ratios: Profitability, underwriting, and efficiency ratios to evaluate performance.
- Dashboard and Charts: Visual summaries of valuation outcomes and assumptions.
Disclaimer
All information, articles, and product details provided on this website are for general informational and educational purposes only. We do not claim any ownership over, nor do we intend to infringe upon, any trademarks, copyrights, logos, brand names, or other intellectual property mentioned or depicted on this site. Such intellectual property remains the property of its respective owners, and any references here are made solely for identification or informational purposes, without implying any affiliation, endorsement, or partnership.
We make no representations or warranties, express or implied, regarding the accuracy, completeness, or suitability of any content or products presented. Nothing on this website should be construed as legal, tax, investment, financial, medical, or other professional advice. In addition, no part of this site—including articles or product references—constitutes a solicitation, recommendation, endorsement, advertisement, or offer to buy or sell any securities, franchises, or other financial instruments, particularly in jurisdictions where such activity would be unlawful.
All content is of a general nature and may not address the specific circumstances of any individual or entity. It is not a substitute for professional advice or services. Any actions you take based on the information provided here are strictly at your own risk. You accept full responsibility for any decisions or outcomes arising from your use of this website and agree to release us from any liability in connection with your use of, or reliance upon, the content or products found herein.