
|
Sage Therapeutics, Inc. (Salbei) DCF -Bewertung |
Fully Editable: Tailor To Your Needs In Excel Or Sheets
Professional Design: Trusted, Industry-Standard Templates
Investor-Approved Valuation Models
MAC/PC Compatible, Fully Unlocked
No Expertise Is Needed; Easy To Follow
Sage Therapeutics, Inc. (SAGE) Bundle
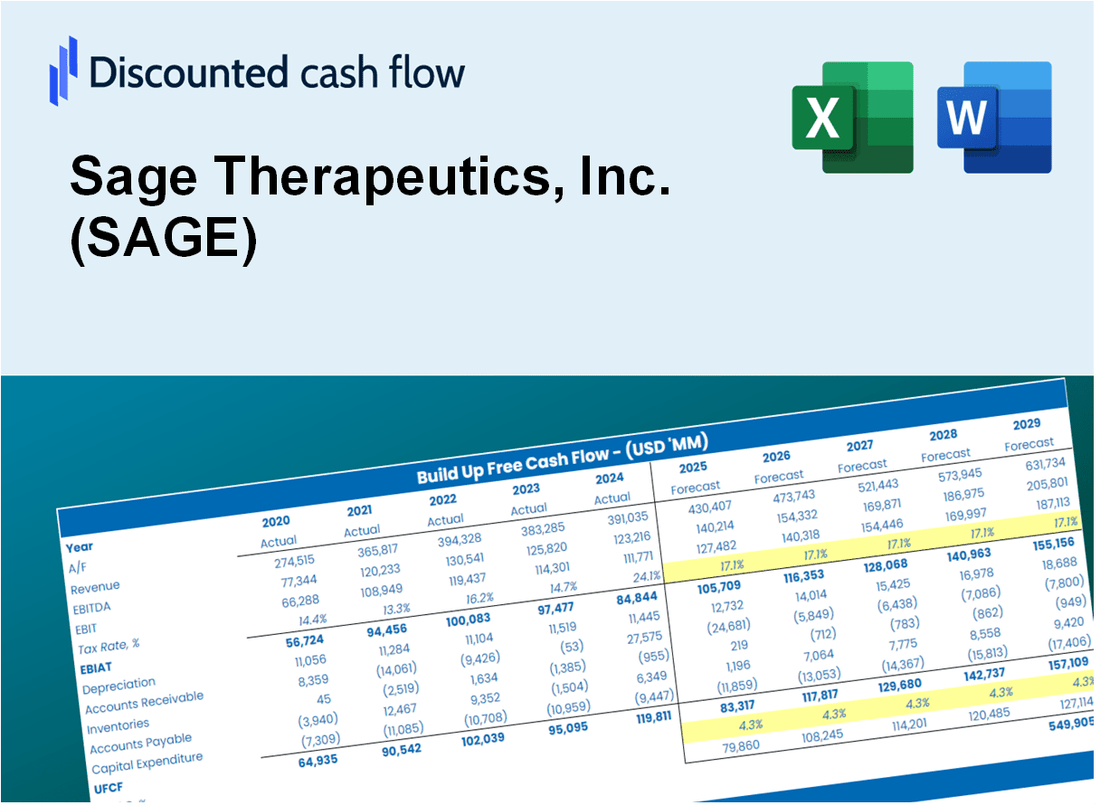
Gewinnen Sie Einblicke in Ihre Sage Therapeutics, Inc. (SAGE) Bewertungsanalyse unter Verwendung unseres ausgeklügelten DCF -Taschenrechners! Diese Excel -Vorlage wird mit authentischen Daten (Sage) vorgeladen, sodass Sie Prognosen und Annahmen für eine genaue Berechnung des intrinsischen Wertes von Sage Therapeutics anpassen können.
Discounted Cash Flow (DCF) - (USD MM)
| Year | AY1 2020 |
AY2 2021 |
AY3 2022 |
AY4 2023 |
AY5 2024 |
FY1 2025 |
FY2 2026 |
FY3 2027 |
FY4 2028 |
FY5 2029 |
|---|---|---|---|---|---|---|---|---|---|---|
| Revenue | 1,114.2 | 6.3 | 7.7 | 86.5 | 41.2 | 38.2 | 35.3 | 32.7 | 30.2 | 28.0 |
| Revenue Growth, % | 0 | -99.43 | 21.85 | 1024.84 | -52.3 | -7.47 | -7.47 | -7.47 | -7.47 | -7.47 |
| EBITDA | 626.6 | -456.7 | -545.9 | -545.1 | -409.5 | -26.2 | -24.3 | -22.5 | -20.8 | -19.2 |
| EBITDA, % | 56.24 | -7240.44 | -7102.09 | -630.47 | -992.86 | -68.75 | -68.75 | -68.75 | -68.75 | -68.75 |
| Depreciation | 2.6 | 4.2 | 1.1 | 1.4 | 1.0 | 6.5 | 6.0 | 5.6 | 5.2 | 4.8 |
| Depreciation, % | 0.23604 | 66.3 | 14.6 | 1.61 | 2.5 | 17.05 | 17.05 | 17.05 | 17.05 | 17.05 |
| EBIT | 624.0 | -460.9 | -547.0 | -546.5 | -410.5 | -26.3 | -24.3 | -22.5 | -20.8 | -19.2 |
| EBIT, % | 56 | -7306.74 | -7116.69 | -632.08 | -995.36 | -68.8 | -68.8 | -68.8 | -68.8 | -68.8 |
| Total Cash | 2,101.3 | 1,742.3 | 1,272.5 | 753.2 | 504.4 | 38.2 | 35.3 | 32.7 | 30.2 | 28.0 |
| Total Cash, percent | .0 | .0 | .0 | .0 | .0 | .0 | .0 | .0 | .0 | .0 |
| Account Receivables | .0 | 18.5 | 13.7 | 83.0 | 9.1 | 24.3 | 22.5 | 20.8 | 19.2 | 17.8 |
| Account Receivables, % | 0 | 293.37 | 177.73 | 96.01 | 22.15 | 63.63 | 63.63 | 63.63 | 63.63 | 63.63 |
| Inventories | .0 | -18.5 | -64.5 | .0 | .0 | -15.3 | -14.1 | -13.1 | -12.1 | -11.2 |
| Inventories, % | 0 | -293.37 | -839.01 | 0 | 0 | -40 | -40 | -40 | -40 | -40 |
| Accounts Payable | 3.7 | 10.5 | 19.0 | 10.3 | 12.7 | 18.6 | 17.2 | 15.9 | 14.7 | 13.6 |
| Accounts Payable, % | 0.33127 | 165.66 | 246.55 | 11.93 | 30.79 | 48.61 | 48.61 | 48.61 | 48.61 | 48.61 |
| Capital Expenditure | -.3 | -.4 | -.9 | -.6 | .0 | -1.4 | -1.3 | -1.2 | -1.1 | -1.0 |
| Capital Expenditure, % | -0.03096392 | -5.9 | -12.19 | -0.63964 | 0 | -3.75 | -3.75 | -3.75 | -3.75 | -3.75 |
| Tax Rate, % | 0 | 0 | 0 | 0 | 0 | 0 | 0 | 0 | 0 | 0 |
| EBITAT | 624.0 | -453.8 | -516.7 | -546.5 | -410.5 | -25.9 | -23.9 | -22.2 | -20.5 | -19.0 |
| Depreciation | ||||||||||
| Changes in Account Receivables | ||||||||||
| Changes in Inventories | ||||||||||
| Changes in Accounts Payable | ||||||||||
| Capital Expenditure | ||||||||||
| UFCF | 629.9 | -443.2 | -457.2 | -688.1 | -333.2 | -14.8 | -20.0 | -18.5 | -17.1 | -15.8 |
| WACC, % | 5.32 | 5.32 | 5.31 | 5.32 | 5.32 | 5.32 | 5.32 | 5.32 | 5.32 | 5.32 |
| PV UFCF | ||||||||||
| SUM PV UFCF | -74.0 | |||||||||
| Long Term Growth Rate, % | 2.00 | |||||||||
| Free cash flow (T + 1) | -16 | |||||||||
| Terminal Value | -487 | |||||||||
| Present Terminal Value | -376 | |||||||||
| Enterprise Value | -450 | |||||||||
| Net Debt | -69 | |||||||||
| Equity Value | -380 | |||||||||
| Diluted Shares Outstanding, MM | 61 | |||||||||
| Equity Value Per Share | -6.26 |
What You Will Get
- Editable Excel Template: A fully customizable Excel-based DCF Calculator featuring pre-filled real SAGE financials.
- Real-World Data: Historical data and forward-looking estimates (as displayed in the yellow cells).
- Forecast Flexibility: Modify forecast assumptions such as revenue growth, EBITDA %, and WACC.
- Automatic Calculations: Instantly observe the effect of your inputs on Sage Therapeutics’ valuation.
- Professional Tool: Designed for investors, CFOs, consultants, and financial analysts.
- User-Friendly Design: Organized for clarity and ease of use, complete with step-by-step instructions.
Key Features
- Real-Life SAGE Data: Pre-filled with Sage Therapeutics' historical financials and forward-looking projections.
- Fully Customizable Inputs: Adjust revenue growth, margins, WACC, tax rates, and capital expenditures.
- Dynamic Valuation Model: Automatic updates to Net Present Value (NPV) and intrinsic value based on your inputs.
- Scenario Testing: Create multiple forecast scenarios to analyze different valuation outcomes.
- User-Friendly Design: Simple, structured, and designed for professionals and beginners alike.
How It Works
- Step 1: Download the prebuilt Excel template containing Sage Therapeutics, Inc.'s (SAGE) data.
- Step 2: Navigate through the pre-filled sheets to familiarize yourself with the essential metrics.
- Step 3: Modify forecasts and assumptions in the editable yellow cells (WACC, growth, margins).
- Step 4: Instantly see the recalculated results, including Sage Therapeutics, Inc.'s (SAGE) intrinsic value.
- Step 5: Make well-informed investment decisions or create reports based on the outputs.
Why Choose This Calculator for Sage Therapeutics, Inc. (SAGE)?
- Precision: Utilizes real Sage financial data for optimal accuracy.
- Versatility: Built for users to easily manipulate and test various inputs.
- Efficiency: Eliminate the need to create a DCF model from the ground up.
- Expert-Level: Crafted with the expertise and functionality expected by finance professionals.
- Intuitive: Simple to navigate, even for individuals without extensive financial modeling knowledge.
Who Should Use Sage Therapeutics, Inc. (SAGE)?
- Healthcare Investors: Make informed decisions with insights into innovative therapies and market potential.
- Pharmaceutical Analysts: Streamline your analysis with comprehensive data on drug development and clinical trials.
- Consultants: Easily modify reports for clients focusing on biotech investments and strategies.
- Biotech Enthusiasts: Enhance your knowledge of therapeutic advancements and industry trends.
- Educators and Students: Utilize as a resource for studying the biotechnology sector and its impact on healthcare.
What the Template Contains
- Operating and Balance Sheet Data: Pre-filled Sage Therapeutics historical data and forecasts, including revenue, EBITDA, EBIT, and capital expenditures.
- WACC Calculation: A dedicated sheet for Weighted Average Cost of Capital (WACC), including parameters like Beta, risk-free rate, and share price.
- DCF Valuation (Unlevered and Levered): Editable Discounted Cash Flow models showing intrinsic value with detailed calculations.
- Financial Statements: Pre-loaded financial statements (annual and quarterly) to support analysis.
- Key Ratios: Includes profitability, leverage, and efficiency ratios for Sage Therapeutics, Inc. (SAGE).
- Dashboard and Charts: Visual summary of valuation outputs and assumptions to analyze results easily.
Disclaimer
All information, articles, and product details provided on this website are for general informational and educational purposes only. We do not claim any ownership over, nor do we intend to infringe upon, any trademarks, copyrights, logos, brand names, or other intellectual property mentioned or depicted on this site. Such intellectual property remains the property of its respective owners, and any references here are made solely for identification or informational purposes, without implying any affiliation, endorsement, or partnership.
We make no representations or warranties, express or implied, regarding the accuracy, completeness, or suitability of any content or products presented. Nothing on this website should be construed as legal, tax, investment, financial, medical, or other professional advice. In addition, no part of this site—including articles or product references—constitutes a solicitation, recommendation, endorsement, advertisement, or offer to buy or sell any securities, franchises, or other financial instruments, particularly in jurisdictions where such activity would be unlawful.
All content is of a general nature and may not address the specific circumstances of any individual or entity. It is not a substitute for professional advice or services. Any actions you take based on the information provided here are strictly at your own risk. You accept full responsibility for any decisions or outcomes arising from your use of this website and agree to release us from any liability in connection with your use of, or reliance upon, the content or products found herein.