
|
Banco Santander, S. A. (San) DCF -Bewertung |
Fully Editable: Tailor To Your Needs In Excel Or Sheets
Professional Design: Trusted, Industry-Standard Templates
Investor-Approved Valuation Models
MAC/PC Compatible, Fully Unlocked
No Expertise Is Needed; Easy To Follow
Banco Santander, S.A. (SAN) Bundle
Entdecken Sie den wahren Wert von Banco Santander, S.A. (SAN) mit unserem fortschrittlichen DCF -Taschenrechner! Passen Sie kritische Annahmen an, erkunden Sie verschiedene Szenarien und bewerten Sie, wie sich Verschiebungen auf die Bewertung von Banco Santander, S. A. (SAN) auswirken - alles innerhalb einer umfassenden Excel -Vorlage.
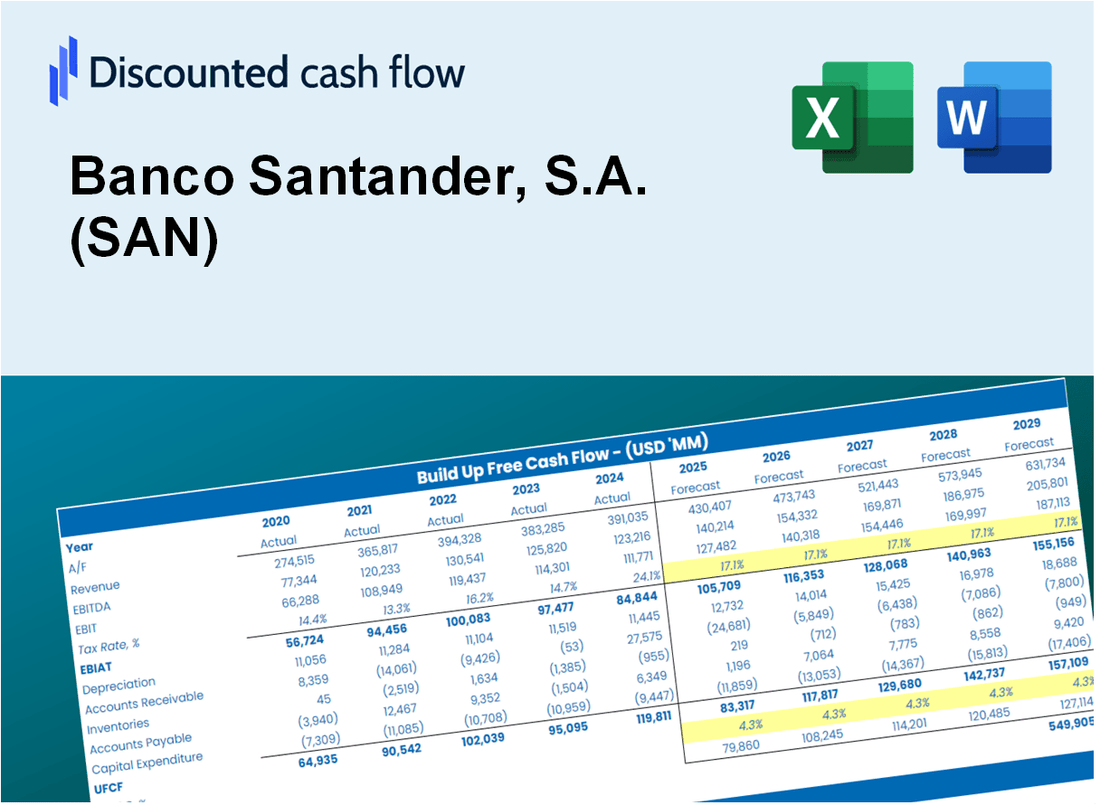
Discounted Cash Flow (DCF) - (USD MM)
| Year | AY1 2020 |
AY2 2021 |
AY3 2022 |
AY4 2023 |
AY5 2024 |
FY1 2025 |
FY2 2026 |
FY3 2027 |
FY4 2028 |
FY5 2029 |
|---|---|---|---|---|---|---|---|---|---|---|
| Revenue | 70,141.4 | 71,294.9 | 100,889.2 | 141,281.0 | 150,601.7 | 184,406.9 | 225,800.4 | 276,485.4 | 338,547.5 | 414,540.7 |
| Revenue Growth, % | 0 | 1.64 | 41.51 | 40.04 | 6.6 | 22.45 | 22.45 | 22.45 | 22.45 | 22.45 |
| EBITDA | 850.9 | 20,059.1 | 21,139.6 | 22,771.9 | 25,876.4 | 30,833.6 | 37,754.7 | 46,229.5 | 56,606.5 | 69,312.8 |
| EBITDA, % | 1.21 | 28.14 | 20.95 | 16.12 | 17.18 | 16.72 | 16.72 | 16.72 | 16.72 | 16.72 |
| Depreciation | 3,257.6 | 3,195.0 | 3,460.5 | 3,691.2 | 3,818.7 | 6,529.5 | 7,995.1 | 9,789.8 | 11,987.2 | 14,678.0 |
| Depreciation, % | 4.64 | 4.48 | 3.43 | 2.61 | 2.54 | 3.54 | 3.54 | 3.54 | 3.54 | 3.54 |
| EBIT | -2,406.7 | 16,864.1 | 17,679.1 | 19,080.7 | 22,057.7 | 24,304.1 | 29,759.6 | 36,439.7 | 44,619.2 | 54,634.8 |
| EBIT, % | -3.43 | 23.65 | 17.52 | 13.51 | 14.65 | 13.18 | 13.18 | 13.18 | 13.18 | 13.18 |
| Total Cash | 178,343.4 | 244,248.8 | 258,605.4 | 311,159.3 | 275,229.5 | 184,406.9 | 225,800.4 | 276,485.4 | 338,547.5 | 414,540.7 |
| Total Cash, percent | .0 | .0 | .0 | .0 | .0 | .0 | .0 | .0 | .0 | .0 |
| Account Receivables | 6,190.6 | 6,672.8 | 10,665.4 | 12,315.1 | 13,246.0 | 17,064.6 | 20,895.1 | 25,585.4 | 31,328.5 | 38,360.7 |
| Account Receivables, % | 8.83 | 9.36 | 10.57 | 8.72 | 8.8 | 9.25 | 9.25 | 9.25 | 9.25 | 9.25 |
| Inventories | .0 | .0 | .0 | .0 | .0 | .0 | .0 | .0 | .0 | .0 |
| Inventories, % | 0 | 0 | 0 | 0 | 0 | 0 | 0 | 0 | 0 | 0 |
| Accounts Payable | 2,316.3 | 2,782.3 | 3,506.8 | 3,853.5 | 2,844.9 | 5,641.8 | 6,908.2 | 8,458.9 | 10,357.7 | 12,682.6 |
| Accounts Payable, % | 3.3 | 3.9 | 3.48 | 2.73 | 1.89 | 3.06 | 3.06 | 3.06 | 3.06 | 3.06 |
| Capital Expenditure | -9,877.1 | -13,219.3 | -12,566.7 | -15,816.1 | -9,847.0 | -23,166.2 | -28,366.2 | -34,733.5 | -42,530.1 | -52,076.8 |
| Capital Expenditure, % | -14.08 | -18.54 | -12.46 | -11.19 | -6.54 | -12.56 | -12.56 | -12.56 | -12.56 | -12.56 |
| Tax Rate, % | 33.91 | 33.91 | 33.91 | 33.91 | 33.91 | 33.91 | 33.91 | 33.91 | 33.91 | 33.91 |
| EBITAT | -10,168.1 | 9,418.0 | 11,134.9 | 12,840.3 | 14,576.9 | 17,120.3 | 20,963.3 | 25,668.8 | 31,430.7 | 38,485.8 |
| Depreciation | ||||||||||
| Changes in Account Receivables | ||||||||||
| Changes in Inventories | ||||||||||
| Changes in Accounts Payable | ||||||||||
| Capital Expenditure | ||||||||||
| UFCF | -20,662.0 | -622.5 | -1,239.3 | -587.8 | 6,609.1 | -538.1 | -1,971.9 | -2,414.6 | -2,956.5 | -3,620.2 |
| WACC, % | 12.43 | 7.78 | 8.53 | 8.98 | 8.86 | 9.31 | 9.31 | 9.31 | 9.31 | 9.31 |
| PV UFCF | ||||||||||
| SUM PV UFCF | -8,380.5 | |||||||||
| Long Term Growth Rate, % | 2.00 | |||||||||
| Free cash flow (T + 1) | -3,693 | |||||||||
| Terminal Value | -50,481 | |||||||||
| Present Terminal Value | -32,340 | |||||||||
| Enterprise Value | -40,720 | |||||||||
| Net Debt | 307,772 | |||||||||
| Equity Value | -348,492 | |||||||||
| Diluted Shares Outstanding, MM | 15,568 | |||||||||
| Equity Value Per Share | -22.39 |
What You Will Get
- Real SAN Financial Data: Pre-filled with Banco Santander’s historical and projected data for precise analysis.
- Fully Editable Template: Modify key inputs like revenue growth, WACC, and EBITDA % with ease.
- Automatic Calculations: See Banco Santander’s intrinsic value update instantly based on your changes.
- Professional Valuation Tool: Designed for investors, analysts, and consultants seeking accurate DCF results.
- User-Friendly Design: Simple structure and clear instructions for all experience levels.
Key Features
- Comprehensive Historical Data: Banco Santander’s (SAN) extensive financial records and pre-populated projections.
- Customizable Parameters: Modify WACC, tax rates, revenue growth, and net interest margins.
- Real-Time Calculations: Observe Banco Santander’s intrinsic value update instantly.
- Intuitive Visualizations: Interactive dashboard graphs illustrate valuation outcomes and essential metrics.
- Designed for Precision: A reliable resource for analysts, investors, and finance professionals.
How It Works
- 1. Access the Template: Download and open the Excel file containing Banco Santander, S.A.'s (SAN) financial data.
- 2. Adjust Assumptions: Modify critical inputs such as growth rates, WACC, and capital expenditures.
- 3. Analyze Results Instantly: The DCF model automatically computes intrinsic value and NPV.
- 4. Explore Scenarios: Evaluate various forecasts to investigate different valuation results.
- 5. Present with Assurance: Deliver professional valuation analyses to back your strategic decisions.
Why Choose This Calculator for Banco Santander, S.A. (SAN)?
- Accurate Data: Up-to-date Banco Santander financials provide trustworthy valuation insights.
- Customizable: Tailor essential inputs such as growth rates, WACC, and tax rates to fit your forecasts.
- Time-Saving: Built-in calculations save you the hassle of starting from the ground up.
- Professional-Grade Tool: Crafted for investors, analysts, and financial consultants.
- User-Friendly: An intuitive design and clear instructions ensure accessibility for every user.
Who Should Use This Product?
- Investors: Accurately assess Banco Santander’s fair value before making investment choices.
- CFOs: Utilize a professional-grade DCF model for financial reporting and analysis related to Banco Santander (SAN).
- Consultants: Efficiently modify the template for valuation reports tailored to clients interested in Banco Santander (SAN).
- Entrepreneurs: Acquire insights into financial modeling practices employed by leading banks like Banco Santander (SAN).
- Educators: Implement it as a teaching resource to illustrate valuation techniques relevant to Banco Santander (SAN).
What the Template Contains
- Comprehensive DCF Model: Editable template featuring detailed valuation calculations tailored for Banco Santander, S.A. (SAN).
- Real-World Data: Banco Santander’s historical and projected financials preloaded for thorough analysis.
- Customizable Parameters: Modify WACC, growth rates, and tax assumptions to explore various scenarios.
- Financial Statements: Complete annual and quarterly breakdowns for enhanced insights into performance.
- Key Ratios: Integrated analysis covering profitability, efficiency, and leverage metrics.
- Dashboard with Visual Outputs: Visualizations including charts and tables for clear, actionable results.
Disclaimer
All information, articles, and product details provided on this website are for general informational and educational purposes only. We do not claim any ownership over, nor do we intend to infringe upon, any trademarks, copyrights, logos, brand names, or other intellectual property mentioned or depicted on this site. Such intellectual property remains the property of its respective owners, and any references here are made solely for identification or informational purposes, without implying any affiliation, endorsement, or partnership.
We make no representations or warranties, express or implied, regarding the accuracy, completeness, or suitability of any content or products presented. Nothing on this website should be construed as legal, tax, investment, financial, medical, or other professional advice. In addition, no part of this site—including articles or product references—constitutes a solicitation, recommendation, endorsement, advertisement, or offer to buy or sell any securities, franchises, or other financial instruments, particularly in jurisdictions where such activity would be unlawful.
All content is of a general nature and may not address the specific circumstances of any individual or entity. It is not a substitute for professional advice or services. Any actions you take based on the information provided here are strictly at your own risk. You accept full responsibility for any decisions or outcomes arising from your use of this website and agree to release us from any liability in connection with your use of, or reliance upon, the content or products found herein.