
|
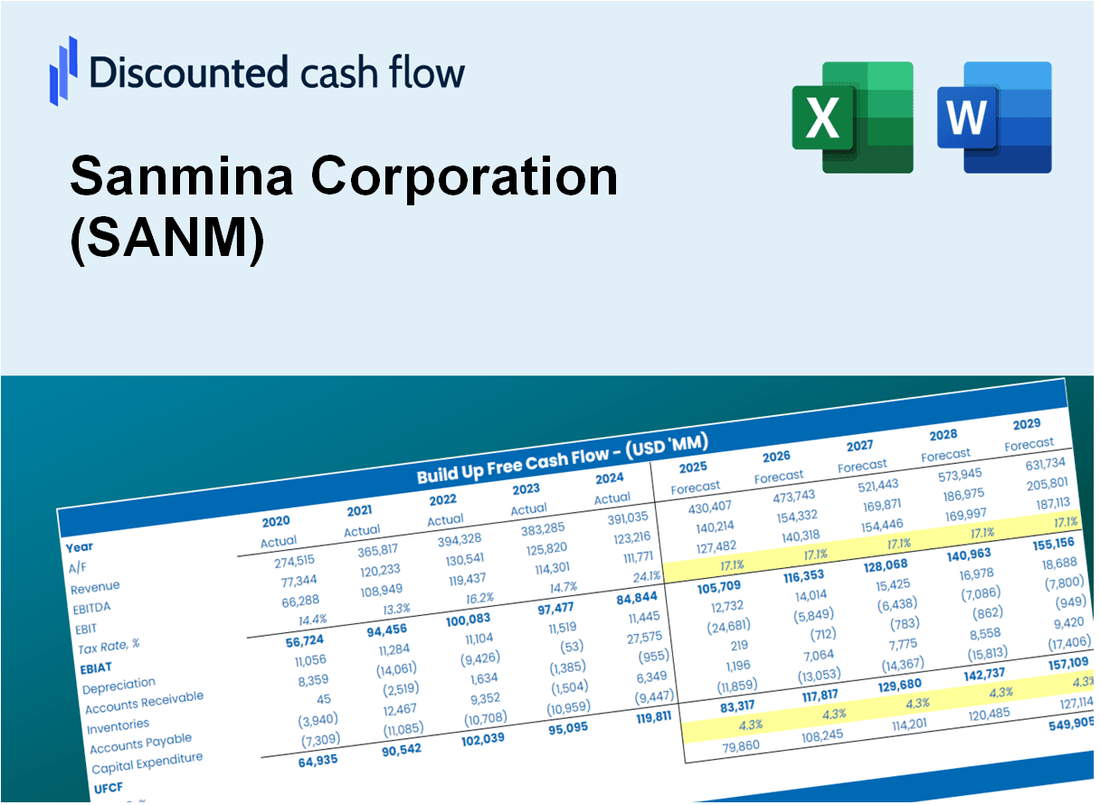
DCF -Bewertung der Sanmina Corporation (SANM) |
Fully Editable: Tailor To Your Needs In Excel Or Sheets
Professional Design: Trusted, Industry-Standard Templates
Investor-Approved Valuation Models
MAC/PC Compatible, Fully Unlocked
No Expertise Is Needed; Easy To Follow
Sanmina Corporation (SANM) Bundle
Bewerten Sie die finanziellen Aussichten von Sanmina Corporation (SANM) wie ein Experte! Dieser (SANM) DCF-Taschenrechner bietet Ihnen vorgefüllte Finanzdaten und vollständige Flexibilität, um das Umsatzwachstum, WACC, Margen und andere wesentliche Annahmen zu ändern, um sich an Ihren Projektionen zu übereinstimmen.
Discounted Cash Flow (DCF) - (USD MM)
| Year | AY1 2021 |
AY2 2022 |
AY3 2023 |
AY4 2024 |
AY5 2025 |
FY1 2026 |
FY2 2027 |
FY3 2028 |
FY4 2029 |
FY5 2030 |
|---|---|---|---|---|---|---|---|---|---|---|
| Revenue | 6,738.4 | 7,919.6 | 8,935.0 | 7,568.3 | 8,128.4 | 8,584.7 | 9,066.7 | 9,575.7 | 10,113.2 | 10,681.0 |
| Revenue Growth, % | 0 | 17.53 | 12.82 | -15.3 | 7.4 | 5.61 | 5.61 | 5.61 | 5.61 | 5.61 |
| EBITDA | 410.8 | 433.6 | 567.3 | 469.1 | 463.2 | 512.0 | 540.7 | 571.1 | 603.1 | 637.0 |
| EBITDA, % | 6.1 | 5.47 | 6.35 | 6.2 | 5.7 | 5.96 | 5.96 | 5.96 | 5.96 | 5.96 |
| Depreciation | 109.7 | 108.8 | 118.2 | 122.4 | 119.5 | 127.3 | 134.4 | 141.9 | 149.9 | 158.3 |
| Depreciation, % | 1.63 | 1.37 | 1.32 | 1.62 | 1.47 | 1.48 | 1.48 | 1.48 | 1.48 | 1.48 |
| EBIT | 301.2 | 324.8 | 449.1 | 346.7 | 343.7 | 384.7 | 406.3 | 429.1 | 453.2 | 478.7 |
| EBIT, % | 4.47 | 4.1 | 5.03 | 4.58 | 4.23 | 4.48 | 4.48 | 4.48 | 4.48 | 4.48 |
| Total Cash | 650.0 | 529.9 | 667.6 | 625.9 | 926.3 | 746.4 | 788.3 | 832.6 | 879.3 | 928.7 |
| Total Cash, percent | .0 | .0 | .0 | .0 | .0 | .0 | .0 | .0 | .0 | .0 |
| Account Receivables | 1,541.2 | 1,614.6 | 1,676.5 | 1,721.6 | 1,826.1 | 1,841.2 | 1,944.5 | 2,053.7 | 2,169.0 | 2,290.8 |
| Account Receivables, % | 22.87 | 20.39 | 18.76 | 22.75 | 22.47 | 21.45 | 21.45 | 21.45 | 21.45 | 21.45 |
| Inventories | 1,036.5 | 1,684.1 | 1,477.2 | 1,443.6 | 1,988.5 | 1,660.6 | 1,753.8 | 1,852.3 | 1,956.3 | 2,066.1 |
| Inventories, % | 15.38 | 21.26 | 16.53 | 19.07 | 24.46 | 19.34 | 19.34 | 19.34 | 19.34 | 19.34 |
| Accounts Payable | 1,464.7 | 2,041.4 | 1,612.8 | 1,442.0 | 1,578.9 | 1,786.3 | 1,886.6 | 1,992.5 | 2,104.4 | 2,222.5 |
| Accounts Payable, % | 21.74 | 25.78 | 18.05 | 19.05 | 19.42 | 20.81 | 20.81 | 20.81 | 20.81 | 20.81 |
| Capital Expenditure | -72.2 | -138.6 | -191.4 | -111.2 | -142.5 | -140.6 | -148.4 | -156.8 | -165.6 | -174.9 |
| Capital Expenditure, % | -1.07 | -1.75 | -2.14 | -1.47 | -1.75 | -1.64 | -1.64 | -1.64 | -1.64 | -1.64 |
| Tax Rate, % | 27.56 | 27.56 | 27.56 | 27.56 | 27.56 | 27.56 | 27.56 | 27.56 | 27.56 | 27.56 |
| EBITAT | 266.9 | 258.3 | 337.2 | 243.0 | 249.0 | 296.8 | 313.5 | 331.1 | 349.6 | 369.3 |
| Depreciation | ||||||||||
| Changes in Account Receivables | ||||||||||
| Changes in Inventories | ||||||||||
| Changes in Accounts Payable | ||||||||||
| Capital Expenditure | ||||||||||
| UFCF | -808.7 | 84.1 | -19.5 | 71.8 | -286.4 | 803.7 | 203.1 | 214.5 | 226.5 | 239.3 |
| WACC, % | 8.48 | 8.47 | 8.47 | 8.46 | 8.46 | 8.47 | 8.47 | 8.47 | 8.47 | 8.47 |
| PV UFCF | ||||||||||
| SUM PV UFCF | 1,404.7 | |||||||||
| Long Term Growth Rate, % | 3.50 | |||||||||
| Free cash flow (T + 1) | 248 | |||||||||
| Terminal Value | 4,984 | |||||||||
| Present Terminal Value | 3,319 | |||||||||
| Enterprise Value | 4,724 | |||||||||
| Net Debt | -626 | |||||||||
| Equity Value | 5,350 | |||||||||
| Diluted Shares Outstanding, MM | 55 | |||||||||
| Equity Value Per Share | 96.96 |
What You Will Get
- Real Sanmina Data: Preloaded financials – from revenue to EBIT – based on actual and projected figures.
- Full Customization: Adjust all critical parameters (yellow cells) like WACC, growth %, and tax rates.
- Instant Valuation Updates: Automatic recalculations to analyze the impact of changes on Sanmina’s fair value.
- Versatile Excel Template: Tailored for quick edits, scenario testing, and detailed projections.
- Time-Saving and Accurate: Skip building models from scratch while maintaining precision and flexibility.
Key Features
- Customizable Financial Inputs: Adjust essential variables such as revenue projections, profit margins, and investment levels.
- Instant DCF Calculations: Automatically determines intrinsic value, NPV, and additional financial metrics.
- High Precision Valuation: Leverages Sanmina Corporation’s (SANM) actual financial data for accurate valuation results.
- Effortless Scenario Testing: Easily evaluate various assumptions and analyze different financial outcomes.
- Efficiency Booster: Avoid the complexities of constructing detailed valuation models from the ground up.
How It Works
- Step 1: Download the prebuilt Excel template featuring Sanmina Corporation’s (SANM) data.
- Step 2: Review the pre-filled sheets to familiarize yourself with the key metrics.
- Step 3: Modify forecasts and assumptions in the editable yellow cells (WACC, growth, margins).
- Step 4: Instantly see the recalculated results, including Sanmina Corporation’s intrinsic value.
- Step 5: Make informed investment choices or create reports based on the outputs.
Why Choose This Calculator for Sanmina Corporation (SANM)?
- All-in-One Solution: Features DCF, WACC, and financial ratio analyses tailored for Sanmina Corporation.
- Flexible Inputs: Modify yellow-highlighted fields to explore different financial scenarios.
- In-Depth Analysis: Automatically computes Sanmina’s intrinsic value and Net Present Value.
- Preloaded Information: Access to historical and projected data for precise calculations.
- High-Quality Standards: Perfect for financial analysts, investors, and business consultants focusing on SANM.
Who Should Use Sanmina Corporation (SANM)?
- Investors: Make informed decisions with a reliable resource for understanding Sanmina's market position.
- Financial Analysts: Streamline your analysis with detailed financial reports and metrics specific to Sanmina Corporation (SANM).
- Consultants: Easily tailor insights from Sanmina for client presentations or strategic recommendations.
- Tech Enthusiasts: Explore the latest innovations and developments within Sanmina Corporation (SANM) to enhance your knowledge of the industry.
- Educators and Students: Utilize Sanmina's case studies and financial data as a practical resource in business and finance education.
What the Template Contains
- Comprehensive DCF Model: Editable template featuring in-depth valuation calculations.
- Real-World Data: Sanmina Corporation’s historical and projected financials preloaded for analysis.
- Customizable Parameters: Modify WACC, growth rates, and tax assumptions to explore various scenarios.
- Financial Statements: Complete annual and quarterly breakdowns for enhanced insights.
- Key Ratios: Integrated analysis for profitability, efficiency, and leverage metrics.
- Dashboard with Visual Outputs: Graphs and tables providing clear, actionable results.
Disclaimer
All information, articles, and product details provided on this website are for general informational and educational purposes only. We do not claim any ownership over, nor do we intend to infringe upon, any trademarks, copyrights, logos, brand names, or other intellectual property mentioned or depicted on this site. Such intellectual property remains the property of its respective owners, and any references here are made solely for identification or informational purposes, without implying any affiliation, endorsement, or partnership.
We make no representations or warranties, express or implied, regarding the accuracy, completeness, or suitability of any content or products presented. Nothing on this website should be construed as legal, tax, investment, financial, medical, or other professional advice. In addition, no part of this site—including articles or product references—constitutes a solicitation, recommendation, endorsement, advertisement, or offer to buy or sell any securities, franchises, or other financial instruments, particularly in jurisdictions where such activity would be unlawful.
All content is of a general nature and may not address the specific circumstances of any individual or entity. It is not a substitute for professional advice or services. Any actions you take based on the information provided here are strictly at your own risk. You accept full responsibility for any decisions or outcomes arising from your use of this website and agree to release us from any liability in connection with your use of, or reliance upon, the content or products found herein.