
|
SANSERA ENGINEERING LIMITED (SANSERA.NS) DCF -Bewertung |
Fully Editable: Tailor To Your Needs In Excel Or Sheets
Professional Design: Trusted, Industry-Standard Templates
Investor-Approved Valuation Models
MAC/PC Compatible, Fully Unlocked
No Expertise Is Needed; Easy To Follow
Sansera Engineering Limited (SANSERA.NS) Bundle
Bewerten Sie die finanziellen Aussichten von Sansera Engineering Limited (SANSERANS) wie ein Experte! Dieser (SANSERAN) DCF-Taschenrechner bietet Ihnen vorgefüllte Finanzdaten und bietet vollständige Flexibilität, um das Umsatzwachstum, die WACC, die Gewinnmargen und andere wichtige Annahmen zu ändern, um sich an Ihren Vorhersagen auszurichten.
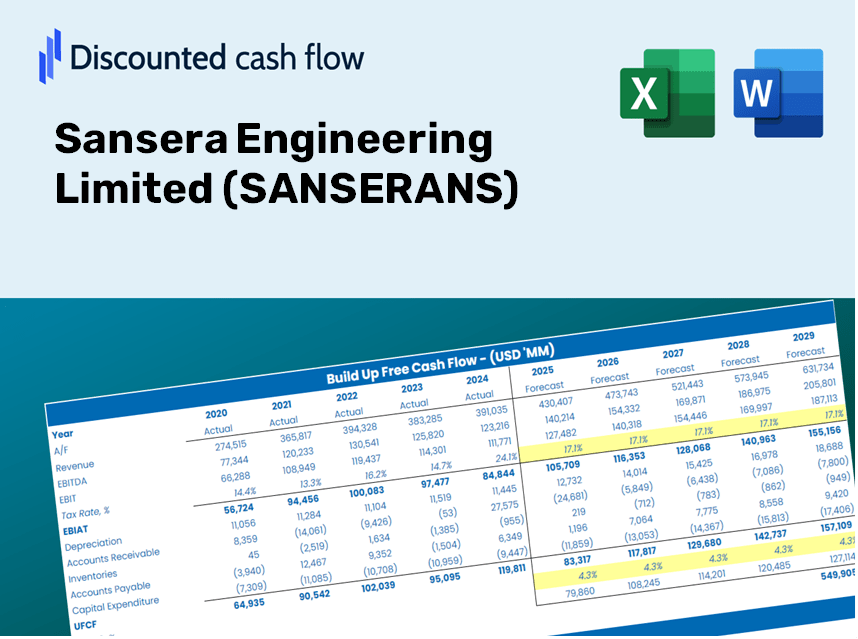
Discounted Cash Flow (DCF) - (USD MM)
| Year | AY1 2021 |
AY2 2022 |
AY3 2023 |
AY4 2024 |
AY5 2025 |
FY1 2026 |
FY2 2027 |
FY3 2028 |
FY4 2029 |
FY5 2030 |
|---|---|---|---|---|---|---|---|---|---|---|
| Revenue | 14,571.2 | 19,890.3 | 23,305.8 | 28,114.3 | 30,167.5 | 36,322.5 | 43,733.3 | 52,656.2 | 63,399.5 | 76,334.8 |
| Revenue Growth, % | 0 | 36.5 | 17.17 | 20.63 | 7.3 | 20.4 | 20.4 | 20.4 | 20.4 | 20.4 |
| EBITDA | 2,969.6 | 3,499.5 | 3,936.9 | 4,822.8 | 5,350.1 | 6,520.3 | 7,850.6 | 9,452.3 | 11,380.9 | 13,702.9 |
| EBITDA, % | 20.38 | 17.59 | 16.89 | 17.15 | 17.73 | 17.95 | 17.95 | 17.95 | 17.95 | 17.95 |
| Depreciation | 1,016.8 | 1,197.0 | 1,300.8 | 1,494.8 | 1,738.1 | 2,154.3 | 2,593.9 | 3,123.1 | 3,760.3 | 4,527.5 |
| Depreciation, % | 6.98 | 6.02 | 5.58 | 5.32 | 5.76 | 5.93 | 5.93 | 5.93 | 5.93 | 5.93 |
| EBIT | 1,952.9 | 2,302.5 | 2,636.1 | 3,328.0 | 3,612.0 | 4,365.9 | 5,256.7 | 6,329.2 | 7,620.5 | 9,175.3 |
| EBIT, % | 13.4 | 11.58 | 11.31 | 11.84 | 11.97 | 12.02 | 12.02 | 12.02 | 12.02 | 12.02 |
| Total Cash | 647.6 | 483.4 | 616.0 | 639.9 | 4,281.2 | 1,887.7 | 2,272.8 | 2,736.6 | 3,294.9 | 3,967.1 |
| Total Cash, percent | .0 | .0 | .0 | .0 | .0 | .0 | .0 | .0 | .0 | .0 |
| Account Receivables | 3,180.1 | 4,333.0 | 4,540.5 | 4,773.5 | 4,579.0 | 6,919.3 | 8,331.1 | 10,030.8 | 12,077.4 | 14,541.6 |
| Account Receivables, % | 21.82 | 21.78 | 19.48 | 16.98 | 15.18 | 19.05 | 19.05 | 19.05 | 19.05 | 19.05 |
| Inventories | 2,485.7 | 2,776.0 | 3,709.6 | 4,189.1 | 5,010.4 | 5,698.4 | 6,861.0 | 8,260.9 | 9,946.3 | 11,975.7 |
| Inventories, % | 17.06 | 13.96 | 15.92 | 14.9 | 16.61 | 15.69 | 15.69 | 15.69 | 15.69 | 15.69 |
| Accounts Payable | 2,004.8 | 2,653.0 | 2,926.8 | 3,557.7 | 3,623.4 | 4,672.5 | 5,625.8 | 6,773.7 | 8,155.7 | 9,819.7 |
| Accounts Payable, % | 13.76 | 13.34 | 12.56 | 12.65 | 12.01 | 12.86 | 12.86 | 12.86 | 12.86 | 12.86 |
| Capital Expenditure | -1,351.2 | -2,675.1 | -2,432.0 | -3,369.3 | -5,938.9 | -4,709.5 | -5,670.3 | -6,827.2 | -8,220.2 | -9,897.3 |
| Capital Expenditure, % | -9.27 | -13.45 | -10.44 | -11.98 | -19.69 | -12.97 | -12.97 | -12.97 | -12.97 | -12.97 |
| Tax Rate, % | 26.11 | 26.11 | 26.11 | 26.11 | 26.11 | 26.11 | 26.11 | 26.11 | 26.11 | 26.11 |
| EBITAT | 1,443.0 | 1,683.9 | 1,896.2 | 2,412.0 | 2,668.9 | 3,190.0 | 3,840.8 | 4,624.4 | 5,568.0 | 6,704.0 |
| Depreciation | ||||||||||
| Changes in Account Receivables | ||||||||||
| Changes in Inventories | ||||||||||
| Changes in Accounts Payable | ||||||||||
| Capital Expenditure | ||||||||||
| UFCF | -2,552.5 | -589.1 | -102.3 | 455.9 | -2,093.0 | -1,344.4 | -856.7 | -1,031.5 | -1,241.9 | -1,495.3 |
| WACC, % | 6.58 | 6.57 | 6.56 | 6.57 | 6.58 | 6.57 | 6.57 | 6.57 | 6.57 | 6.57 |
| PV UFCF | ||||||||||
| SUM PV UFCF | -4,918.3 | |||||||||
| Long Term Growth Rate, % | 4.00 | |||||||||
| Free cash flow (T + 1) | -1,555 | |||||||||
| Terminal Value | -60,445 | |||||||||
| Present Terminal Value | -43,967 | |||||||||
| Enterprise Value | -48,885 | |||||||||
| Net Debt | -201 | |||||||||
| Equity Value | -48,684 | |||||||||
| Diluted Shares Outstanding, MM | 61 | |||||||||
| Equity Value Per Share | -803.71 |
Benefits of Choosing Sansera Engineering Limited (SANSERANS)
- Pre-Filled Financial Model: Leverage Sansera's actual data for accurate DCF valuation.
- Comprehensive Forecast Control: Modify key inputs such as revenue growth, margins, WACC, and more.
- Real-Time Calculations: Automatic updates provide instant visibility to your adjustments.
- Professional-Grade Template: A polished Excel file crafted for expert-level valuation.
- Flexible and Reusable: Designed for adaptability, making it easy to create detailed forecasts repeatedly.
Key Features
- Real-Time SANSERANS Data: Pre-loaded with Sansera Engineering's historical financials and future projections.
- Completely Customizable Inputs: Modify revenue growth, profit margins, WACC, tax rates, and capital expenditures as needed.
- Dynamic Valuation Framework: Automatic recalculations of Net Present Value (NPV) and intrinsic value based on your specific inputs.
- Scenario Analysis: Develop multiple forecasting scenarios to evaluate various valuation possibilities.
- User-Friendly Interface: Intuitive, organized design suitable for both professionals and newcomers.
How It Works
- Step 1: Download the ready-to-use Excel template featuring Sansera Engineering Limited's (SANSERANS) data.
- Step 2: Review the pre-filled sheets to familiarize yourself with the essential metrics.
- Step 3: Modify the forecasts and assumptions in the editable yellow cells (WACC, growth, margins).
- Step 4: Instantly view the updated results, including the intrinsic value of Sansera Engineering Limited (SANSERANS).
- Step 5: Make well-informed investment choices or create reports based on the generated outputs.
Why Opt for This Calculator?
- Designed for Experts: A sophisticated tool utilized by analysts, CFOs, and consultants.
- Accurate Financial Data: Sansera Engineering Limited’s historical and projected financials are preloaded for precision.
- Scenario Simulation: Effortlessly explore various forecasts and assumptions.
- Clear Results: Automatically computes intrinsic value, NPV, and essential metrics.
- User-Friendly: Step-by-step guidance helps you navigate the process with ease.
Who Can Benefit from This Product?
- Finance Students: Explore valuation methods and apply them to real-world data.
- Academics: Integrate industry models into your teaching or research projects.
- Investors: Validate your assumptions and evaluate valuation results for Sansera Engineering Limited (SANSERANS).
- Analysts: Optimize your analysis process with a customizable, ready-to-use DCF model.
- Small Business Owners: Understand the analytical approaches used for large publicly traded companies like Sansera Engineering Limited (SANSERANS).
Contents of the Template
- Pre-Filled Data: Features Sansera Engineering Limited’s historical financials and projections.
- Discounted Cash Flow Model: An editable DCF valuation model with automatic computations.
- Weighted Average Cost of Capital (WACC): A specific sheet for calculating WACC using customized inputs.
- Key Financial Ratios: Examine Sansera's profitability, efficiency, and leverage metrics.
- Customizable Inputs: Effortlessly adjust revenue growth, profit margins, and tax rates.
- Clear Dashboard: Visual representations and tables summarizing essential valuation outcomes.
Disclaimer
All information, articles, and product details provided on this website are for general informational and educational purposes only. We do not claim any ownership over, nor do we intend to infringe upon, any trademarks, copyrights, logos, brand names, or other intellectual property mentioned or depicted on this site. Such intellectual property remains the property of its respective owners, and any references here are made solely for identification or informational purposes, without implying any affiliation, endorsement, or partnership.
We make no representations or warranties, express or implied, regarding the accuracy, completeness, or suitability of any content or products presented. Nothing on this website should be construed as legal, tax, investment, financial, medical, or other professional advice. In addition, no part of this site—including articles or product references—constitutes a solicitation, recommendation, endorsement, advertisement, or offer to buy or sell any securities, franchises, or other financial instruments, particularly in jurisdictions where such activity would be unlawful.
All content is of a general nature and may not address the specific circumstances of any individual or entity. It is not a substitute for professional advice or services. Any actions you take based on the information provided here are strictly at your own risk. You accept full responsibility for any decisions or outcomes arising from your use of this website and agree to release us from any liability in connection with your use of, or reliance upon, the content or products found herein.