
|
Safe Bulkers, Inc. (SB) DCF -Bewertung |
Fully Editable: Tailor To Your Needs In Excel Or Sheets
Professional Design: Trusted, Industry-Standard Templates
Investor-Approved Valuation Models
MAC/PC Compatible, Fully Unlocked
No Expertise Is Needed; Easy To Follow
Safe Bulkers, Inc. (SB) Bundle
Unser DCF-Taschenrechner für Safe Bulkers, Inc. (SB) für die Genauigkeit ermöglicht es Ihnen, die Bewertung der Safe Bulkers, Inc. unter Verwendung realer Finanzdaten zu bewerten und umfassende Flexibilität zu bieten, um alle wesentlichen Parameter für verbesserte Projektionen zu ändern.
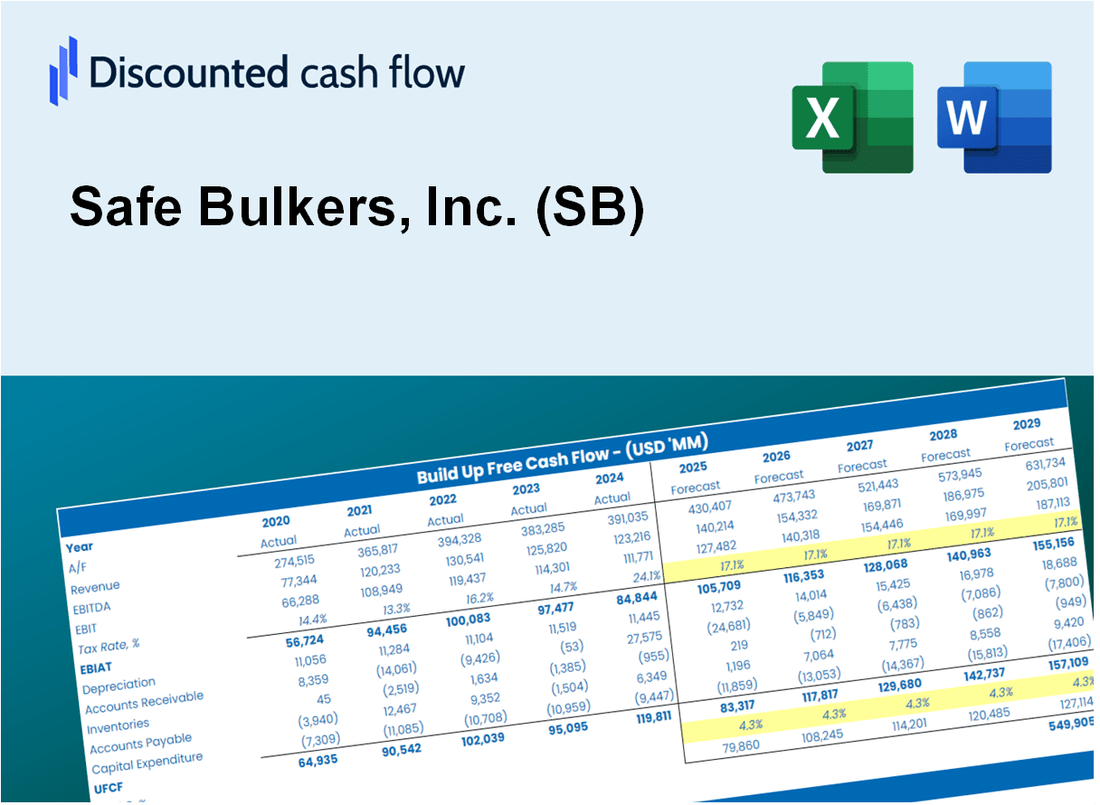
Discounted Cash Flow (DCF) - (USD MM)
| Year | AY1 2020 |
AY2 2021 |
AY3 2022 |
AY4 2023 |
AY5 2024 |
FY1 2025 |
FY2 2026 |
FY3 2027 |
FY4 2028 |
FY5 2029 |
|---|---|---|---|---|---|---|---|---|---|---|
| Revenue | 198.2 | 329.0 | 349.7 | 284.4 | 307.6 | 355.2 | 410.1 | 473.5 | 546.6 | 631.1 |
| Revenue Growth, % | 0 | 66.04 | 6.29 | -18.68 | 8.17 | 15.46 | 15.46 | 15.46 | 15.46 | 15.46 |
| EBITDA | 64.7 | 245.1 | 242.6 | 156.2 | 186.9 | 207.6 | 239.7 | 276.7 | 319.5 | 368.8 |
| EBITDA, % | 32.67 | 74.5 | 69.36 | 54.92 | 60.75 | 58.44 | 58.44 | 58.44 | 58.44 | 58.44 |
| Depreciation | 54.3 | 52.4 | 49.5 | 54.1 | 58.1 | 67.8 | 78.2 | 90.3 | 104.3 | 120.4 |
| Depreciation, % | 27.39 | 15.91 | 14.16 | 19.03 | 18.9 | 19.08 | 19.08 | 19.08 | 19.08 | 19.08 |
| EBIT | 10.5 | 192.8 | 193.1 | 102.1 | 128.8 | 139.8 | 161.4 | 186.4 | 215.2 | 248.4 |
| EBIT, % | 5.29 | 58.59 | 55.2 | 35.89 | 41.85 | 39.36 | 39.36 | 39.36 | 39.36 | 39.36 |
| Total Cash | 101.8 | 102.1 | 113.4 | 87.9 | 125.4 | 132.5 | 153.0 | 176.6 | 203.9 | 235.4 |
| Total Cash, percent | .0 | .0 | .0 | .0 | .0 | .0 | .0 | .0 | .0 | .0 |
| Account Receivables | 5.5 | 8.7 | 7.2 | 9.3 | 15.1 | 11.1 | 12.8 | 14.8 | 17.1 | 19.7 |
| Account Receivables, % | 2.77 | 2.66 | 2.05 | 3.26 | 4.9 | 3.13 | 3.13 | 3.13 | 3.13 | 3.13 |
| Inventories | 12.0 | 8.7 | 17.3 | 16.7 | 14.9 | 17.3 | 20.0 | 23.1 | 26.6 | 30.7 |
| Inventories, % | 6.07 | 2.63 | 4.95 | 5.86 | 4.84 | 4.87 | 4.87 | 4.87 | 4.87 | 4.87 |
| Accounts Payable | 13.5 | 10.0 | 10.5 | 10.4 | 9.9 | 14.0 | 16.2 | 18.7 | 21.6 | 24.9 |
| Accounts Payable, % | 6.8 | 3.03 | 3 | 3.67 | 3.22 | 3.95 | 3.95 | 3.95 | 3.95 | 3.95 |
| Capital Expenditure | -50.4 | -109.2 | -183.3 | -209.1 | -144.8 | -164.6 | -190.0 | -219.3 | -253.3 | -292.4 |
| Capital Expenditure, % | -25.46 | -33.2 | -52.41 | -73.52 | -47.06 | -46.33 | -46.33 | -46.33 | -46.33 | -46.33 |
| Tax Rate, % | 0 | 0 | 0 | 0 | 0 | 0 | 0 | 0 | 0 | 0 |
| EBITAT | 10.5 | 192.8 | 193.1 | 102.1 | 128.8 | 139.8 | 161.4 | 186.4 | 215.2 | 248.4 |
| Depreciation | ||||||||||
| Changes in Account Receivables | ||||||||||
| Changes in Inventories | ||||||||||
| Changes in Accounts Payable | ||||||||||
| Capital Expenditure | ||||||||||
| UFCF | 10.3 | 132.5 | 52.7 | -54.4 | 37.5 | 48.7 | 47.4 | 54.8 | 63.2 | 73.0 |
| WACC, % | 7.63 | 7.63 | 7.63 | 7.63 | 7.63 | 7.63 | 7.63 | 7.63 | 7.63 | 7.63 |
| PV UFCF | ||||||||||
| SUM PV UFCF | 227.8 | |||||||||
| Long Term Growth Rate, % | 0.50 | |||||||||
| Free cash flow (T + 1) | 73 | |||||||||
| Terminal Value | 1,029 | |||||||||
| Present Terminal Value | 713 | |||||||||
| Enterprise Value | 941 | |||||||||
| Net Debt | 456 | |||||||||
| Equity Value | 485 | |||||||||
| Diluted Shares Outstanding, MM | 108 | |||||||||
| Equity Value Per Share | 4.51 |
What You Will Get
- Editable Forecast Inputs: Easily modify assumptions (growth %, margins, WACC) to explore various scenarios.
- Real-World Data: Safe Bulkers, Inc. (SB)’s financial data pre-loaded to kickstart your analysis.
- Automatic DCF Outputs: The template calculates Net Present Value (NPV) and intrinsic value automatically.
- Customizable and Professional: A refined Excel model that adjusts to your valuation requirements.
- Built for Analysts and Investors: Perfect for evaluating projections, confirming strategies, and enhancing efficiency.
Key Features
- Comprehensive DCF Calculator: Offers detailed unlevered and levered DCF valuation models tailored for Safe Bulkers, Inc. (SB).
- WACC Calculator: Features a pre-built Weighted Average Cost of Capital sheet with adjustable inputs for accurate assessments.
- Customizable Forecast Assumptions: Adjust growth rates, capital expenditures, and discount rates to fit your analysis needs.
- Integrated Financial Ratios: Evaluate profitability, leverage, and efficiency ratios specifically for Safe Bulkers, Inc. (SB).
- Interactive Dashboard and Charts: Visual representations summarize essential valuation metrics for straightforward analysis.
How It Works
- 1. Access the Template: Download and open the Excel file containing Safe Bulkers, Inc. (SB) preloaded data.
- 2. Adjust Key Inputs: Modify essential parameters such as growth rates, WACC, and capital expenditures.
- 3. Analyze Results in Real-Time: The DCF model automatically computes intrinsic value and NPV.
- 4. Explore Different Scenarios: Evaluate various forecasts to understand different valuation results.
- 5. Present with Assurance: Share expert valuation insights to enhance your decision-making process.
Why Choose Safe Bulkers, Inc. (SB)?
- Time Efficiency: Skip the hassle of complex shipping logistics – our services are streamlined for immediate use.
- Enhanced Reliability: Our extensive fleet and technology ensure dependable shipping solutions.
- Fully Adaptable: Customize shipping plans to meet your specific needs and requirements.
- Clear Communication: Transparent updates and tracking make it easy to monitor your shipments.
- Industry Expertise: Backed by professionals who prioritize safety and efficiency in maritime operations.
Who Should Use This Product?
- Individual Investors: Gain insights for making informed decisions about buying or selling Safe Bulkers, Inc. (SB) stock.
- Financial Analysts: Enhance valuation methodologies with comprehensive financial models tailored for Safe Bulkers, Inc. (SB).
- Consultants: Provide clients with accurate and timely valuation analyses for Safe Bulkers, Inc. (SB).
- Business Owners: Learn from the valuation metrics of Safe Bulkers, Inc. (SB) to inform your own business strategies.
- Finance Students: Explore real-world valuation techniques using Safe Bulkers, Inc. (SB) data and case studies.
What the Template Contains
- Historical Data: Includes Safe Bulkers, Inc. (SB)’s past financials and baseline forecasts.
- DCF and Levered DCF Models: Detailed templates to calculate Safe Bulkers, Inc. (SB)’s intrinsic value.
- WACC Sheet: Pre-built calculations for Weighted Average Cost of Capital.
- Editable Inputs: Modify key drivers like growth rates, EBITDA %, and CAPEX assumptions.
- Quarterly and Annual Statements: A complete breakdown of Safe Bulkers, Inc. (SB)’s financials.
- Interactive Dashboard: Visualize valuation results and projections dynamically.
Disclaimer
All information, articles, and product details provided on this website are for general informational and educational purposes only. We do not claim any ownership over, nor do we intend to infringe upon, any trademarks, copyrights, logos, brand names, or other intellectual property mentioned or depicted on this site. Such intellectual property remains the property of its respective owners, and any references here are made solely for identification or informational purposes, without implying any affiliation, endorsement, or partnership.
We make no representations or warranties, express or implied, regarding the accuracy, completeness, or suitability of any content or products presented. Nothing on this website should be construed as legal, tax, investment, financial, medical, or other professional advice. In addition, no part of this site—including articles or product references—constitutes a solicitation, recommendation, endorsement, advertisement, or offer to buy or sell any securities, franchises, or other financial instruments, particularly in jurisdictions where such activity would be unlawful.
All content is of a general nature and may not address the specific circumstances of any individual or entity. It is not a substitute for professional advice or services. Any actions you take based on the information provided here are strictly at your own risk. You accept full responsibility for any decisions or outcomes arising from your use of this website and agree to release us from any liability in connection with your use of, or reliance upon, the content or products found herein.