
|
Stepan Company (SCL) DCF -Bewertung |
Fully Editable: Tailor To Your Needs In Excel Or Sheets
Professional Design: Trusted, Industry-Standard Templates
Investor-Approved Valuation Models
MAC/PC Compatible, Fully Unlocked
No Expertise Is Needed; Easy To Follow
Stepan Company (SCL) Bundle
Entdecken Sie das wahre Potenzial von Stepan Company (SCL) mit unserem fortschrittlichen DCF -Taschenrechner! Passen Sie die wesentlichen Annahmen an, erkunden Sie verschiedene Szenarien und bewerten Sie, wie unterschiedliche Faktoren die Bewertung des Stepan Company (SCL) beeinflussen - alles innerhalb einer umfassenden Excel -Vorlage.
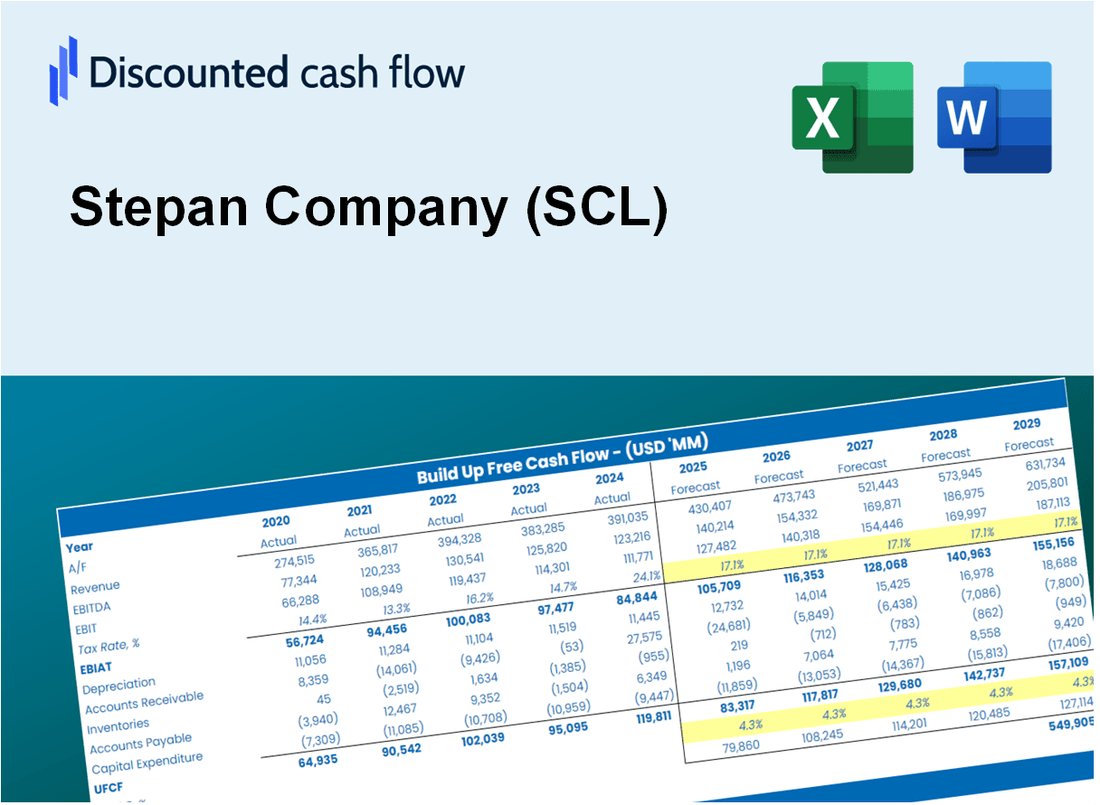
Discounted Cash Flow (DCF) - (USD MM)
| Year | AY1 2020 |
AY2 2021 |
AY3 2022 |
AY4 2023 |
AY5 2024 |
FY1 2025 |
FY2 2026 |
FY3 2027 |
FY4 2028 |
FY5 2029 |
|---|---|---|---|---|---|---|---|---|---|---|
| Revenue | 1,869.8 | 2,346.0 | 2,773.3 | 2,325.8 | 2,180.3 | 2,296.3 | 2,418.6 | 2,547.3 | 2,682.9 | 2,825.7 |
| Revenue Growth, % | 0 | 25.47 | 18.21 | -16.14 | -6.26 | 5.32 | 5.32 | 5.32 | 5.32 | 5.32 |
| EBITDA | 260.5 | 270.4 | 294.2 | 169.7 | 192.1 | 239.6 | 252.4 | 265.8 | 280.0 | 294.9 |
| EBITDA, % | 13.93 | 11.53 | 10.61 | 7.3 | 8.81 | 10.44 | 10.44 | 10.44 | 10.44 | 10.44 |
| Depreciation | 81.9 | 90.9 | 94.7 | 105.3 | 112.2 | 98.0 | 103.2 | 108.7 | 114.5 | 120.6 |
| Depreciation, % | 4.38 | 3.87 | 3.41 | 4.53 | 5.15 | 4.27 | 4.27 | 4.27 | 4.27 | 4.27 |
| EBIT | 178.6 | 179.5 | 199.6 | 64.3 | 79.9 | 141.6 | 149.2 | 157.1 | 165.5 | 174.3 |
| EBIT, % | 9.55 | 7.65 | 7.2 | 2.77 | 3.66 | 6.17 | 6.17 | 6.17 | 6.17 | 6.17 |
| Total Cash | 349.9 | 159.2 | 173.8 | 129.8 | 99.7 | 192.5 | 202.8 | 213.6 | 224.9 | 236.9 |
| Total Cash, percent | .0 | .0 | .0 | .0 | .0 | .0 | .0 | .0 | .0 | .0 |
| Account Receivables | 301.3 | 419.5 | 436.9 | 422.1 | 388.0 | 393.6 | 414.5 | 436.6 | 459.8 | 484.3 |
| Account Receivables, % | 16.12 | 17.88 | 15.75 | 18.15 | 17.8 | 17.14 | 17.14 | 17.14 | 17.14 | 17.14 |
| Inventories | 218.8 | 305.5 | 402.5 | 265.6 | 288.7 | 293.5 | 309.1 | 325.5 | 342.9 | 361.1 |
| Inventories, % | 11.7 | 13.02 | 14.51 | 11.42 | 13.24 | 12.78 | 12.78 | 12.78 | 12.78 | 12.78 |
| Accounts Payable | 236.8 | 323.4 | 375.7 | 233.0 | 258.8 | 284.2 | 299.3 | 315.3 | 332.1 | 349.7 |
| Accounts Payable, % | 12.66 | 13.78 | 13.55 | 10.02 | 11.87 | 12.38 | 12.38 | 12.38 | 12.38 | 12.38 |
| Capital Expenditure | -125.8 | -194.5 | -301.6 | -260.3 | -122.8 | -196.2 | -206.6 | -217.6 | -229.2 | -241.4 |
| Capital Expenditure, % | -6.73 | -8.29 | -10.87 | -11.19 | -5.63 | -8.54 | -8.54 | -8.54 | -8.54 | -8.54 |
| Tax Rate, % | 16.66 | 16.66 | 16.66 | 16.66 | 16.66 | 16.66 | 16.66 | 16.66 | 16.66 | 16.66 |
| EBITAT | 132.4 | 143.4 | 155.6 | 53.5 | 66.6 | 112.8 | 118.8 | 125.2 | 131.8 | 138.8 |
| Depreciation | ||||||||||
| Changes in Account Receivables | ||||||||||
| Changes in Inventories | ||||||||||
| Changes in Accounts Payable | ||||||||||
| Capital Expenditure | ||||||||||
| UFCF | -194.9 | -78.6 | -113.3 | -92.4 | 92.6 | 29.8 | -6.0 | -6.3 | -6.7 | -7.0 |
| WACC, % | 5.95 | 6.03 | 6.01 | 6.08 | 6.08 | 6.03 | 6.03 | 6.03 | 6.03 | 6.03 |
| PV UFCF | ||||||||||
| SUM PV UFCF | 7.0 | |||||||||
| Long Term Growth Rate, % | 3.00 | |||||||||
| Free cash flow (T + 1) | -7 | |||||||||
| Terminal Value | -238 | |||||||||
| Present Terminal Value | -178 | |||||||||
| Enterprise Value | -171 | |||||||||
| Net Debt | 583 | |||||||||
| Equity Value | -754 | |||||||||
| Diluted Shares Outstanding, MM | 23 | |||||||||
| Equity Value Per Share | -32.88 |
What You Will Receive
- Adjustable Forecast Inputs: Effortlessly modify key assumptions (growth %, margins, WACC) to explore various scenarios.
- Comprehensive Financial Data: Stepan Company’s (SCL) financial information pre-loaded to facilitate your analysis.
- Instant DCF Outputs: The template automatically computes Net Present Value (NPV) and intrinsic value for you.
- Tailored and Professional: A refined Excel model that can be customized to fit your valuation requirements.
- Designed for Analysts and Investors: Perfect for evaluating projections, confirming strategies, and enhancing efficiency.
Key Features
- Accurate Stepan Financials: Gain access to reliable pre-loaded historical data and future forecasts for Stepan Company (SCL).
- Tailorable Forecast Assumptions: Modify highlighted cells for key metrics such as WACC, growth rates, and profit margins.
- Real-Time Calculations: Automatic adjustments for DCF, Net Present Value (NPV), and cash flow evaluations.
- User-Friendly Dashboard: Clear charts and summaries to help visualize your valuation outcomes.
- Designed for All Levels: An intuitive layout suitable for investors, CFOs, and consultants alike.
How It Works
- Step 1: Download the Excel file for Stepan Company (SCL).
- Step 2: Review Stepan Company's pre-filled financial data and projections.
- Step 3: Adjust key inputs such as revenue growth, WACC, and tax rates (highlighted cells).
- Step 4: Observe the DCF model refresh in real-time as you modify your assumptions.
- Step 5: Evaluate the outputs and utilize the findings for your investment strategies.
Why Choose This Calculator for Stepan Company (SCL)?
- Reliable Data: Access to authentic Stepan Company financials guarantees dependable valuation outcomes.
- Customizable Features: Tailor essential variables such as growth rates, WACC, and tax rates to fit your forecasts.
- Efficiency Boost: Built-in calculations save time and eliminate the hassle of starting from scratch.
- Professional-Quality Tool: Crafted for the needs of investors, analysts, and consultants.
- User-Centric Design: Simple interface and clear instructions ensure ease of use for everyone.
Who Should Use Stepan Company (SCL)?
- Investors: Gain insights and make informed decisions with a trusted industry leader.
- Financial Analysts: Utilize comprehensive resources to enhance your market analysis.
- Consultants: Adapt Stepan's offerings for impactful client solutions and presentations.
- Industry Professionals: Expand your knowledge of chemical manufacturing and product applications.
- Educators and Students: Explore real-life case studies to enrich finance and business education.
What the Template Contains
- Pre-Filled DCF Model: Stepan Company's financial data preloaded for immediate use.
- WACC Calculator: Detailed calculations for Weighted Average Cost of Capital.
- Financial Ratios: Evaluate Stepan Company's profitability, leverage, and efficiency.
- Editable Inputs: Change assumptions such as growth, margins, and CAPEX to fit your scenarios.
- Financial Statements: Annual and quarterly reports to support detailed analysis.
- Interactive Dashboard: Easily visualize key valuation metrics and results.
Disclaimer
All information, articles, and product details provided on this website are for general informational and educational purposes only. We do not claim any ownership over, nor do we intend to infringe upon, any trademarks, copyrights, logos, brand names, or other intellectual property mentioned or depicted on this site. Such intellectual property remains the property of its respective owners, and any references here are made solely for identification or informational purposes, without implying any affiliation, endorsement, or partnership.
We make no representations or warranties, express or implied, regarding the accuracy, completeness, or suitability of any content or products presented. Nothing on this website should be construed as legal, tax, investment, financial, medical, or other professional advice. In addition, no part of this site—including articles or product references—constitutes a solicitation, recommendation, endorsement, advertisement, or offer to buy or sell any securities, franchises, or other financial instruments, particularly in jurisdictions where such activity would be unlawful.
All content is of a general nature and may not address the specific circumstances of any individual or entity. It is not a substitute for professional advice or services. Any actions you take based on the information provided here are strictly at your own risk. You accept full responsibility for any decisions or outcomes arising from your use of this website and agree to release us from any liability in connection with your use of, or reliance upon, the content or products found herein.