
|
Scopus Biopharma Inc. (SCPS) DCF -Bewertung |
Fully Editable: Tailor To Your Needs In Excel Or Sheets
Professional Design: Trusted, Industry-Standard Templates
Investor-Approved Valuation Models
MAC/PC Compatible, Fully Unlocked
No Expertise Is Needed; Easy To Follow
Scopus BioPharma Inc. (SCPS) Bundle
Stürzen Sie Ihre Analyse und verbessern Sie die Präzision mit unserem (SCP) DCF -Taschenrechner! Ausgestattet mit den aktuellen Daten und anpassbaren Annahmen von Scopus Biopharma Inc., ermöglicht es Ihnen, wie ein erfahrener Investor prognostiziert, bewertet und value (SCPs).
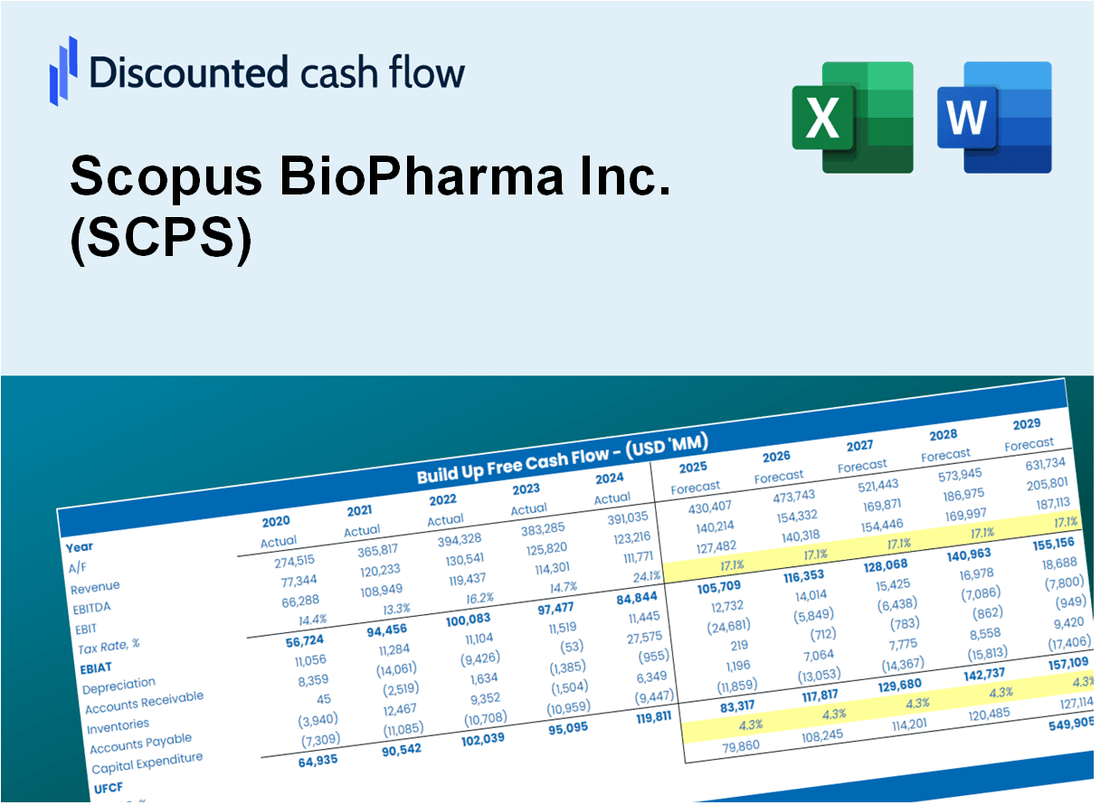
Discounted Cash Flow (DCF) - (USD MM)
| Year | AY1 2018 |
AY2 2019 |
AY3 2020 |
AY4 2021 |
AY5 2022 |
FY1 2023 |
FY2 2024 |
FY3 2025 |
FY4 2026 |
FY5 2027 |
|---|---|---|---|---|---|---|---|---|---|---|
| Revenue | .0 | .0 | .0 | .0 | .0 | .0 | .0 | .0 | .0 | .0 |
| Revenue Growth, % | 0 | 0 | 0 | 0 | 0 | 0 | 0 | 0 | 0 | 0 |
| EBITDA | -.7 | -2.7 | -10.2 | -26.2 | -11.7 | .0 | .0 | .0 | .0 | .0 |
| EBITDA, % | 100 | 100 | 100 | 100 | 100 | 100 | 100 | 100 | 100 | 100 |
| Depreciation | .2 | .0 | .0 | .0 | .0 | .0 | .0 | .0 | .0 | .0 |
| Depreciation, % | 100 | 100 | 100 | 100 | 100 | 100 | 100 | 100 | 100 | 100 |
| EBIT | -.8 | -2.7 | -10.2 | -26.2 | -11.7 | .0 | .0 | .0 | .0 | .0 |
| EBIT, % | 100 | 100 | 100 | 100 | 100 | 100 | 100 | 100 | 100 | 100 |
| Total Cash | .0 | .0 | 1.8 | 7.9 | .1 | .0 | .0 | .0 | .0 | .0 |
| Total Cash, percent | .0 | .0 | .0 | .0 | .0 | .0 | .0 | .0 | .0 | .0 |
| Account Receivables | .0 | .0 | .0 | .0 | .0 | .0 | .0 | .0 | .0 | .0 |
| Account Receivables, % | 100 | 100 | 100 | 100 | 100 | 100 | 100 | 100 | 100 | 100 |
| Inventories | .0 | .0 | .0 | .0 | .0 | .0 | .0 | .0 | .0 | .0 |
| Inventories, % | 100 | 100 | 100 | 100 | 100 | 100 | 100 | 100 | 100 | 100 |
| Accounts Payable | .0 | .0 | .0 | .0 | .0 | .0 | .0 | .0 | .0 | .0 |
| Accounts Payable, % | 100 | 100 | 100 | 100 | 100 | 100 | 100 | 100 | 100 | 100 |
| Capital Expenditure | .0 | .0 | .0 | .0 | .0 | .0 | .0 | .0 | .0 | .0 |
| Capital Expenditure, % | 100 | 100 | 100 | 100 | 100 | 0 | 0 | 0 | 0 | 0 |
| Tax Rate, % | 0.89672 | 0.89672 | 0.89672 | 0.89672 | 0.89672 | 0.89672 | 0.89672 | 0.89672 | 0.89672 | 0.89672 |
| EBITAT | -.8 | -2.7 | -10.8 | -26.9 | -11.6 | .0 | .0 | .0 | .0 | .0 |
| Depreciation | ||||||||||
| Changes in Account Receivables | ||||||||||
| Changes in Inventories | ||||||||||
| Changes in Accounts Payable | ||||||||||
| Capital Expenditure | ||||||||||
| UFCF | -.7 | -2.7 | -10.8 | -26.9 | -11.6 | .0 | .0 | .0 | .0 | .0 |
| WACC, % | 4.68 | 4.68 | 4.68 | 4.68 | 4.68 | 4.68 | 4.68 | 4.68 | 4.68 | 4.68 |
| PV UFCF | ||||||||||
| SUM PV UFCF | .0 | |||||||||
| Long Term Growth Rate, % | 2.00 | |||||||||
| Free cash flow (T + 1) | 0 | |||||||||
| Terminal Value | 0 | |||||||||
| Present Terminal Value | 0 | |||||||||
| Enterprise Value | 0 | |||||||||
| Net Debt | 0 | |||||||||
| Equity Value | 0 | |||||||||
| Diluted Shares Outstanding, MM | 21 | |||||||||
| Equity Value Per Share | 0.01 |
What You Will Get
- Editable Forecast Inputs: Easily modify key assumptions (growth %, margins, WACC) to explore various scenarios.
- Real-World Data: Scopus BioPharma Inc.’s (SCPS) financial data pre-loaded to facilitate your analysis.
- Automatic DCF Outputs: The template computes Net Present Value (NPV) and intrinsic value automatically.
- Customizable and Professional: A sleek Excel model designed to meet your valuation requirements.
- Built for Analysts and Investors: Perfect for assessing projections, validating strategies, and enhancing efficiency.
Key Features
- Comprehensive Financial Data: Gain access to precise pre-loaded historical data and future forecasts for Scopus BioPharma Inc. (SCPS).
- Adjustable Forecast Parameters: Modify highlighted cells for key metrics such as WACC, growth rates, and profit margins.
- Real-Time Calculations: Automatic refresh of DCF, Net Present Value (NPV), and cash flow analysis.
- User-Friendly Dashboard: Clear and informative charts and summaries to help visualize your valuation outcomes.
- Designed for All Skill Levels: An intuitive layout tailored for investors, CFOs, and consultants alike.
How It Works
- Download: Obtain the pre-built Excel file featuring Scopus BioPharma Inc.'s (SCPS) financial data.
- Customize: Modify projections, such as revenue growth, EBITDA %, and WACC.
- Update Automatically: The intrinsic value and NPV calculations refresh in real-time.
- Test Scenarios: Generate various projections and instantly compare results.
- Make Decisions: Leverage the valuation findings to inform your investment strategy.
Why Choose This Calculator for Scopus BioPharma Inc. (SCPS)?
- Designed for Industry Experts: A sophisticated tool tailored for biopharma analysts, investors, and strategic planners.
- Comprehensive Data: Scopus BioPharma’s historical and projected financials are preloaded for reliable analysis.
- Flexible Scenario Analysis: Effortlessly test various forecasts and assumptions to gauge potential outcomes.
- Insightful Outputs: Automatically computes intrinsic value, NPV, and essential financial metrics.
- User-Friendly Interface: Step-by-step guidance ensures a seamless experience throughout the calculation process.
Who Should Use Scopus BioPharma Inc. (SCPS)?
- Investors: Gain insights into innovative biopharmaceutical solutions backed by extensive research.
- Healthcare Analysts: Utilize comprehensive data to assess market potential and company performance.
- Consultants: Tailor presentations and reports with up-to-date information on cutting-edge therapies.
- Biotech Enthusiasts: Explore the latest advancements in drug development and therapeutic strategies.
- Educators and Students: Leverage real-world case studies to enhance learning in biotechnology and finance.
What the Template Contains
- Operating and Balance Sheet Data: Pre-filled Scopus BioPharma Inc. (SCPS) historical data and forecasts, including revenue, EBITDA, EBIT, and capital expenditures.
- WACC Calculation: A dedicated sheet for Weighted Average Cost of Capital (WACC), featuring parameters like Beta, risk-free rate, and share price.
- DCF Valuation (Unlevered and Levered): Editable Discounted Cash Flow models demonstrating intrinsic value with comprehensive calculations.
- Financial Statements: Pre-loaded financial statements (annual and quarterly) to facilitate analysis.
- Key Ratios: Includes profitability, leverage, and efficiency ratios for Scopus BioPharma Inc. (SCPS).
- Dashboard and Charts: Visual summary of valuation outputs and assumptions to easily analyze results.
Disclaimer
All information, articles, and product details provided on this website are for general informational and educational purposes only. We do not claim any ownership over, nor do we intend to infringe upon, any trademarks, copyrights, logos, brand names, or other intellectual property mentioned or depicted on this site. Such intellectual property remains the property of its respective owners, and any references here are made solely for identification or informational purposes, without implying any affiliation, endorsement, or partnership.
We make no representations or warranties, express or implied, regarding the accuracy, completeness, or suitability of any content or products presented. Nothing on this website should be construed as legal, tax, investment, financial, medical, or other professional advice. In addition, no part of this site—including articles or product references—constitutes a solicitation, recommendation, endorsement, advertisement, or offer to buy or sell any securities, franchises, or other financial instruments, particularly in jurisdictions where such activity would be unlawful.
All content is of a general nature and may not address the specific circumstances of any individual or entity. It is not a substitute for professional advice or services. Any actions you take based on the information provided here are strictly at your own risk. You accept full responsibility for any decisions or outcomes arising from your use of this website and agree to release us from any liability in connection with your use of, or reliance upon, the content or products found herein.