
|
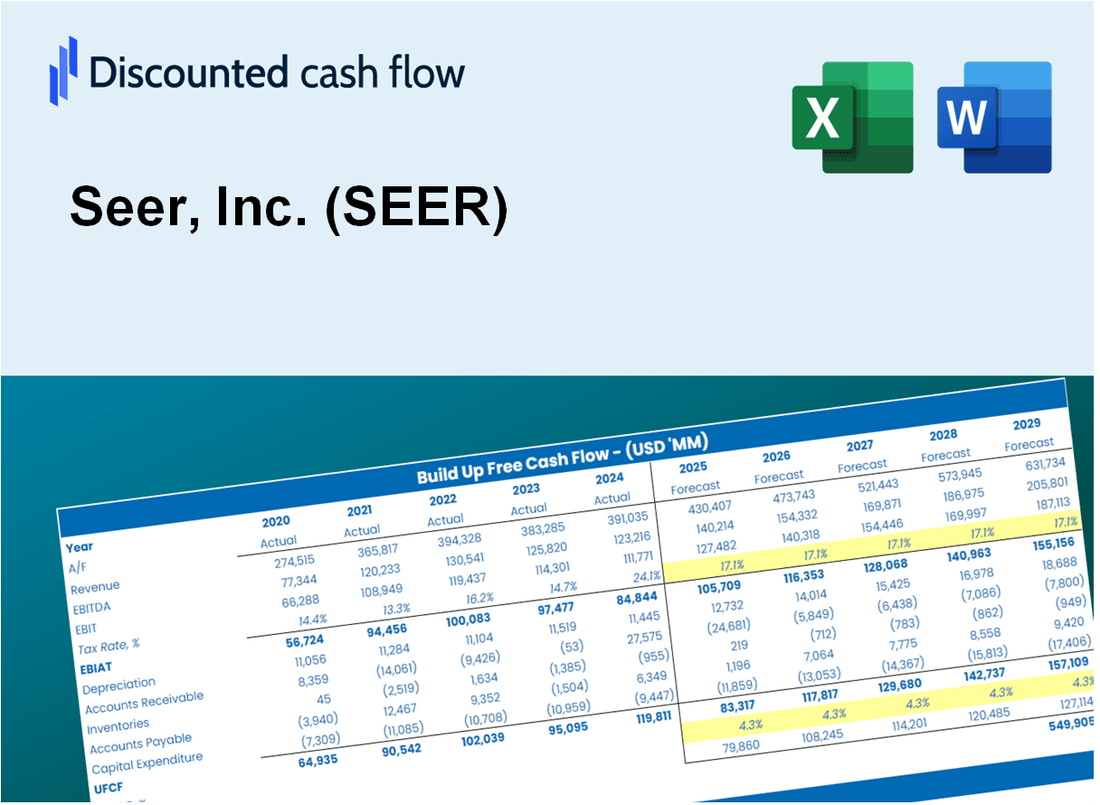
DCF -Bewertung von Seer, Inc. (SEER) |
Fully Editable: Tailor To Your Needs In Excel Or Sheets
Professional Design: Trusted, Industry-Standard Templates
Investor-Approved Valuation Models
MAC/PC Compatible, Fully Unlocked
No Expertise Is Needed; Easy To Follow
Seer, Inc. (SEER) Bundle
Unser (SEER) DCF-Taschenrechner entwickelt für Genauigkeit und ermöglicht es Ihnen, die Bewertung von Seer, Inc. mit aktuellen Finanzdaten zu bewerten und alle Schlüsselparameter für verbesserte Prognosen zu ändern.
Discounted Cash Flow (DCF) - (USD MM)
| Year | AY1 2020 |
AY2 2021 |
AY3 2022 |
AY4 2023 |
AY5 2024 |
FY1 2025 |
FY2 2026 |
FY3 2027 |
FY4 2028 |
FY5 2029 |
|---|---|---|---|---|---|---|---|---|---|---|
| Revenue | .7 | 6.4 | 14.7 | 15.2 | 13.9 | 20.8 | 30.9 | 46.0 | 68.4 | 101.8 |
| Revenue Growth, % | 0 | 874.7 | 129.67 | 3.38 | -8.13 | 48.81 | 48.81 | 48.81 | 48.81 | 48.81 |
| EBITDA | -31.2 | -67.6 | -87.1 | -80.7 | -93.9 | -20.8 | -30.9 | -46.0 | -68.4 | -101.8 |
| EBITDA, % | -4751.37 | -1057.34 | -592.88 | -531.54 | -673.44 | -100 | -100 | -100 | -100 | -100 |
| Depreciation | 1.6 | 3.6 | 5.9 | 5.6 | 6.2 | 11.5 | 17.1 | 25.5 | 37.9 | 56.4 |
| Depreciation, % | 244.82 | 55.72 | 40.18 | 36.74 | 44.28 | 55.39 | 55.39 | 55.39 | 55.39 | 55.39 |
| EBIT | -32.8 | -71.2 | -93.0 | -86.3 | -100.1 | -20.8 | -30.9 | -46.0 | -68.4 | -101.8 |
| EBIT, % | -4996.19 | -1113.06 | -633.07 | -568.28 | -717.72 | -100 | -100 | -100 | -100 | -100 |
| Total Cash | 431.9 | 400.1 | 421.2 | 316.2 | 236.4 | 20.8 | 30.9 | 46.0 | 68.4 | 101.8 |
| Total Cash, percent | .1 | .0 | .0 | .0 | .0 | .0 | .0 | .0 | .0 | .0 |
| Account Receivables | .3 | 4.1 | 7.0 | 6.7 | 6.2 | 10.0 | 14.9 | 22.2 | 33.0 | 49.1 |
| Account Receivables, % | 39.94 | 64.81 | 47.79 | 44.24 | 44.66 | 48.29 | 48.29 | 48.29 | 48.29 | 48.29 |
| Inventories | .6 | 4.1 | 4.6 | 4.5 | 7.4 | 10.9 | 16.3 | 24.2 | 36.0 | 53.6 |
| Inventories, % | 83.99 | 64.83 | 31.51 | 29.58 | 53.32 | 52.65 | 52.65 | 52.65 | 52.65 | 52.65 |
| Accounts Payable | 2.1 | 3.8 | 2.1 | 1.4 | 4.6 | 9.0 | 13.3 | 19.8 | 29.5 | 43.9 |
| Accounts Payable, % | 322.41 | 59.26 | 14.33 | 9.02 | 33.13 | 43.15 | 43.15 | 43.15 | 43.15 | 43.15 |
| Capital Expenditure | -4.5 | -6.9 | -10.3 | -7.3 | -3.6 | -14.3 | -21.2 | -31.6 | -47.0 | -70.0 |
| Capital Expenditure, % | -691.16 | -108.26 | -69.9 | -48.14 | -25.7 | -68.75 | -68.75 | -68.75 | -68.75 | -68.75 |
| Tax Rate, % | -0.11329 | -0.11329 | -0.11329 | -0.11329 | -0.11329 | -0.11329 | -0.11329 | -0.11329 | -0.11329 | -0.11329 |
| EBITAT | -32.8 | -71.2 | -93.0 | -86.3 | -100.2 | -20.8 | -30.9 | -46.0 | -68.4 | -101.8 |
| Depreciation | ||||||||||
| Changes in Account Receivables | ||||||||||
| Changes in Inventories | ||||||||||
| Changes in Accounts Payable | ||||||||||
| Capital Expenditure | ||||||||||
| UFCF | -34.4 | -80.3 | -102.4 | -88.3 | -96.8 | -26.5 | -40.9 | -60.8 | -90.5 | -134.7 |
| WACC, % | 9.97 | 9.97 | 9.97 | 9.97 | 9.97 | 9.97 | 9.97 | 9.97 | 9.97 | 9.97 |
| PV UFCF | ||||||||||
| SUM PV UFCF | -249.2 | |||||||||
| Long Term Growth Rate, % | 2.00 | |||||||||
| Free cash flow (T + 1) | -137 | |||||||||
| Terminal Value | -1,723 | |||||||||
| Present Terminal Value | -1,071 | |||||||||
| Enterprise Value | -1,321 | |||||||||
| Net Debt | -15 | |||||||||
| Equity Value | -1,306 | |||||||||
| Diluted Shares Outstanding, MM | 62 | |||||||||
| Equity Value Per Share | -20.95 |
What You Will Receive
- Customizable Excel Template: A fully adjustable Excel-based DCF Calculator featuring pre-filled real SEER financials.
- Authentic Data: Historical data and future projections (highlighted in the yellow cells).
- Flexible Forecasting: Adjust forecast assumptions such as revenue growth, EBITDA %, and WACC.
- Instant Calculations: Quickly observe how your inputs affect Seer’s valuation.
- Professional Resource: Designed for investors, CFOs, consultants, and financial analysts.
- Intuitive Layout: Organized for clarity and ease of navigation, complete with step-by-step guidance.
Key Features
- Comprehensive Data Insights: Gain access to detailed historical performance and future forecasts for Seer, Inc. (SEER).
- Tailored Analysis Parameters: Modify highlighted fields such as revenue growth, operational costs, and market trends.
- Real-Time Financial Modeling: Instantaneous updates to valuation metrics, including DCF, Net Present Value (NPV), and profit analysis.
- Interactive Visualization Tools: User-friendly graphs and summaries to enhance your financial assessment of Seer, Inc. (SEER).
- Designed for All Skill Levels: An accessible layout suitable for investors, analysts, and financial advisors alike.
How It Works
- Step 1: Download the prebuilt Excel template featuring Seer, Inc.'s (SEER) data.
- Step 2: Navigate through the pre-filled sheets to grasp the essential metrics.
- Step 3: Modify forecasts and assumptions in the editable yellow cells (WACC, growth, margins).
- Step 4: Instantly see recalculated results, including Seer, Inc.'s (SEER) intrinsic value.
- Step 5: Make well-informed investment decisions or create reports using the generated outputs.
Why Choose Seer, Inc. (SEER) Calculator?
- Designed for Experts: A sophisticated tool utilized by industry analysts, financial officers, and strategic consultants.
- Comprehensive Data: Seer’s historical and projected financial data preloaded for precision.
- Flexible Scenario Analysis: Effortlessly test various forecasts and assumptions.
- Insightful Outputs: Automatically computes intrinsic value, NPV, and essential financial metrics.
- User-Friendly: Step-by-step guidance ensures a smooth user experience.
Who Should Use Seer, Inc. (SEER)?
- Investors: Gain insights into innovative biotech solutions with a reliable investment analysis tool.
- Financial Analysts: Streamline your workflow with a comprehensive financial model tailored for biotech companies.
- Consultants: Easily modify the framework for client discussions or strategic reports.
- Biotech Enthusiasts: Enhance your knowledge of the biotech sector with practical applications and case studies.
- Educators and Students: Utilize it as a hands-on resource in life sciences and finance courses.
What the Template Contains
- Pre-Filled DCF Model: Seer, Inc.’s (SEER) financial data preloaded for immediate use.
- WACC Calculator: Detailed calculations for Weighted Average Cost of Capital.
- Financial Ratios: Evaluate Seer, Inc.’s (SEER) profitability, leverage, and efficiency.
- Editable Inputs: Change assumptions such as growth, margins, and CAPEX to fit your scenarios.
- Financial Statements: Annual and quarterly reports to support detailed analysis.
- Interactive Dashboard: Easily visualize key valuation metrics and results.
Disclaimer
All information, articles, and product details provided on this website are for general informational and educational purposes only. We do not claim any ownership over, nor do we intend to infringe upon, any trademarks, copyrights, logos, brand names, or other intellectual property mentioned or depicted on this site. Such intellectual property remains the property of its respective owners, and any references here are made solely for identification or informational purposes, without implying any affiliation, endorsement, or partnership.
We make no representations or warranties, express or implied, regarding the accuracy, completeness, or suitability of any content or products presented. Nothing on this website should be construed as legal, tax, investment, financial, medical, or other professional advice. In addition, no part of this site—including articles or product references—constitutes a solicitation, recommendation, endorsement, advertisement, or offer to buy or sell any securities, franchises, or other financial instruments, particularly in jurisdictions where such activity would be unlawful.
All content is of a general nature and may not address the specific circumstances of any individual or entity. It is not a substitute for professional advice or services. Any actions you take based on the information provided here are strictly at your own risk. You accept full responsibility for any decisions or outcomes arising from your use of this website and agree to release us from any liability in connection with your use of, or reliance upon, the content or products found herein.