
|
Stifel Financial Corp. (SF) DCF -Bewertung |
Fully Editable: Tailor To Your Needs In Excel Or Sheets
Professional Design: Trusted, Industry-Standard Templates
Investor-Approved Valuation Models
MAC/PC Compatible, Fully Unlocked
No Expertise Is Needed; Easy To Follow
Stifel Financial Corp. (SF) Bundle
Verbessern Sie Ihre Anlagestrategien mit dem DCF -Taschenrechner von Stifel Financial Corp. (SF)! Verwenden Sie authentische Stifel -Finanzdaten, passen Sie Wachstumsprojektionen und -kosten an und beobachten Sie sofort, wie sich diese Modifikationen auf den inneren Wert von Stifel Financial Corp. (SF) auswirken.
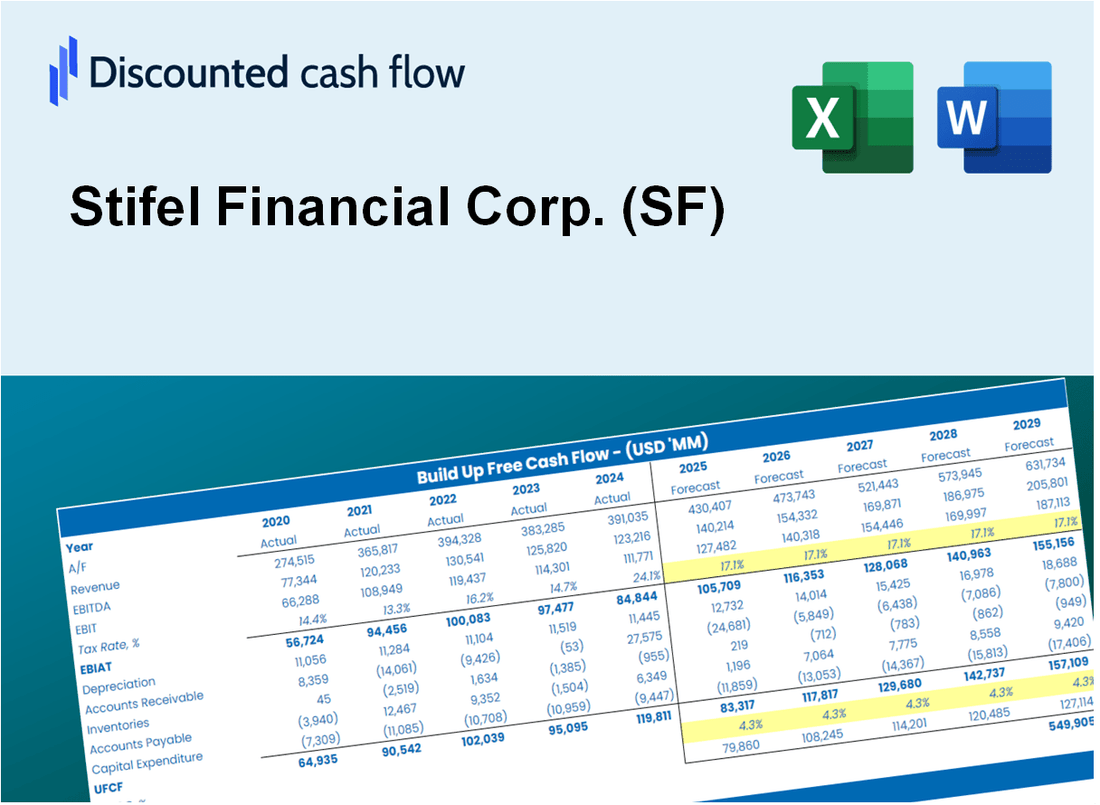
Discounted Cash Flow (DCF) - (USD MM)
| Year | AY1 2020 |
AY2 2021 |
AY3 2022 |
AY4 2023 |
AY5 2024 |
FY1 2025 |
FY2 2026 |
FY3 2027 |
FY4 2028 |
FY5 2029 |
|---|---|---|---|---|---|---|---|---|---|---|
| Revenue | 3,826.6 | 4,788.9 | 4,580.8 | 5,159.4 | 5,947.6 | 6,671.8 | 7,484.3 | 8,395.7 | 9,418.0 | 10,564.8 |
| Revenue Growth, % | 0 | 25.15 | -4.35 | 12.63 | 15.28 | 12.18 | 12.18 | 12.18 | 12.18 | 12.18 |
| EBITDA | .0 | 1,237.5 | 1,077.1 | 936.8 | 1,178.1 | 1,165.2 | 1,307.1 | 1,466.2 | 1,644.8 | 1,845.1 |
| EBITDA, % | 0 | 25.84 | 23.51 | 18.16 | 19.81 | 17.46 | 17.46 | 17.46 | 17.46 | 17.46 |
| Depreciation | 60.5 | 63.8 | 70.2 | 81.5 | 86.0 | 99.7 | 111.8 | 125.4 | 140.7 | 157.8 |
| Depreciation, % | 1.58 | 1.33 | 1.53 | 1.58 | 1.45 | 1.49 | 1.49 | 1.49 | 1.49 | 1.49 |
| EBIT | -60.5 | 1,173.7 | 1,006.9 | 855.4 | 1,092.2 | 1,065.5 | 1,195.3 | 1,340.8 | 1,504.1 | 1,687.2 |
| EBIT, % | -1.58 | 24.51 | 21.98 | 16.58 | 18.36 | 15.97 | 15.97 | 15.97 | 15.97 | 15.97 |
| Total Cash | 4,509.6 | 4,077.2 | 3,836.0 | 3,361.8 | 2,996.2 | 5,129.5 | 5,754.1 | 6,454.8 | 7,240.8 | 8,122.6 |
| Total Cash, percent | .0 | .0 | .0 | .0 | .0 | .0 | .0 | .0 | .0 | .0 |
| Account Receivables | 1,486.0 | 1,727.1 | 1,342.5 | 1,255.7 | 1,099.1 | 1,961.8 | 2,200.7 | 2,468.7 | 2,769.3 | 3,106.5 |
| Account Receivables, % | 38.83 | 36.07 | 29.31 | 24.34 | 18.48 | 29.4 | 29.4 | 29.4 | 29.4 | 29.4 |
| Inventories | .0 | .0 | .0 | .0 | .0 | .0 | .0 | .0 | .0 | .0 |
| Inventories, % | 0 | 0 | 0 | 0 | 0 | 0 | 0 | 0 | 0 | 0 |
| Accounts Payable | 2,411.6 | 2,363.8 | 2,129.6 | 1,251.3 | 1,215.2 | 2,716.2 | 3,046.9 | 3,417.9 | 3,834.1 | 4,301.0 |
| Accounts Payable, % | 63.02 | 49.36 | 46.49 | 24.25 | 20.43 | 40.71 | 40.71 | 40.71 | 40.71 | 40.71 |
| Capital Expenditure | -73.4 | -188.2 | -82.3 | -52.0 | -73.8 | -132.0 | -148.1 | -166.1 | -186.3 | -209.0 |
| Capital Expenditure, % | -1.92 | -3.93 | -1.8 | -1.01 | -1.24 | -1.98 | -1.98 | -1.98 | -1.98 | -1.98 |
| Tax Rate, % | 21.23 | 21.23 | 21.23 | 21.23 | 21.23 | 21.23 | 21.23 | 21.23 | 21.23 | 21.23 |
| EBITAT | -46.8 | 907.3 | 753.3 | 632.5 | 860.3 | 814.4 | 913.5 | 1,024.8 | 1,149.6 | 1,289.5 |
| Depreciation | ||||||||||
| Changes in Account Receivables | ||||||||||
| Changes in Inventories | ||||||||||
| Changes in Accounts Payable | ||||||||||
| Capital Expenditure | ||||||||||
| UFCF | 866.0 | 494.0 | 891.6 | -129.5 | 992.9 | 1,420.3 | 969.1 | 1,087.1 | 1,219.5 | 1,368.0 |
| WACC, % | 13.28 | 13.28 | 13.12 | 13.06 | 13.38 | 13.22 | 13.22 | 13.22 | 13.22 | 13.22 |
| PV UFCF | ||||||||||
| SUM PV UFCF | 4,236.9 | |||||||||
| Long Term Growth Rate, % | 2.00 | |||||||||
| Free cash flow (T + 1) | 1,395 | |||||||||
| Terminal Value | 12,435 | |||||||||
| Present Terminal Value | 6,684 | |||||||||
| Enterprise Value | 10,920 | |||||||||
| Net Debt | -1,374 | |||||||||
| Equity Value | 12,295 | |||||||||
| Diluted Shares Outstanding, MM | 111 | |||||||||
| Equity Value Per Share | 110.79 |
What You Will Get
- Pre-Filled Financial Model: Stifel Financial Corp.’s actual data enables precise DCF valuation.
- Full Forecast Control: Adjust revenue growth, margins, WACC, and other key drivers.
- Instant Calculations: Automatic updates ensure you see results as you make changes.
- Investor-Ready Template: A refined Excel file designed for professional-grade valuation.
- Customizable and Reusable: Tailored for flexibility, allowing repeated use for detailed forecasts.
Key Features
- Accurate Stifel Financials: Gain access to reliable pre-loaded historical data and future forecasts.
- Adjustable Forecast Parameters: Modify highlighted cells for metrics such as WACC, growth rates, and profit margins.
- Real-Time Calculations: Automatic updates for DCF, Net Present Value (NPV), and cash flow assessments.
- Interactive Dashboard: User-friendly charts and summaries to help visualize your valuation outcomes.
- Designed for All Levels: An intuitive layout tailored for investors, CFOs, and consultants alike.
How It Works
- Step 1: Download the Excel file for Stifel Financial Corp. (SF).
- Step 2: Review Stifel’s pre-filled financial data and projections.
- Step 3: Adjust key inputs such as revenue growth, WACC, and tax rates (highlighted cells).
- Step 4: Observe the DCF model update in real-time as you modify your assumptions.
- Step 5: Evaluate the outputs and leverage the results for your investment strategies.
Why Choose Stifel Financial Corp. (SF) Calculator?
- Precision: Utilizes Stifel's financial data to ensure reliable results.
- Adaptability: Allows users to easily adjust and experiment with various inputs.
- Efficiency: Eliminate the need to create a financial model from the ground up.
- Expert-Level: Crafted with the expertise and functionality expected by financial professionals.
- Intuitive: Simple to navigate, suitable for users with varying levels of financial knowledge.
Who Should Utilize Stifel Financial Corp. (SF)?
- Investors: Evaluate Stifel's performance and make informed investment decisions.
- CFOs and Financial Analysts: Enhance financial analysis and projections for accurate assessments.
- Startup Founders: Understand the financial metrics that drive valuations in the financial services sector.
- Consultants: Create detailed financial reports and insights for clients seeking investment strategies.
- Students and Educators: Access real-time data to learn and teach financial analysis methodologies.
What the Template Contains
- Pre-Filled Data: Includes Stifel Financial Corp.'s historical financials and forecasts.
- Discounted Cash Flow Model: Editable DCF valuation model with automatic calculations.
- Weighted Average Cost of Capital (WACC): A dedicated sheet for calculating WACC based on custom inputs.
- Key Financial Ratios: Analyze Stifel Financial Corp.'s profitability, efficiency, and leverage.
- Customizable Inputs: Edit revenue growth, margins, and tax rates with ease.
- Clear Dashboard: Charts and tables summarizing key valuation results.
Disclaimer
All information, articles, and product details provided on this website are for general informational and educational purposes only. We do not claim any ownership over, nor do we intend to infringe upon, any trademarks, copyrights, logos, brand names, or other intellectual property mentioned or depicted on this site. Such intellectual property remains the property of its respective owners, and any references here are made solely for identification or informational purposes, without implying any affiliation, endorsement, or partnership.
We make no representations or warranties, express or implied, regarding the accuracy, completeness, or suitability of any content or products presented. Nothing on this website should be construed as legal, tax, investment, financial, medical, or other professional advice. In addition, no part of this site—including articles or product references—constitutes a solicitation, recommendation, endorsement, advertisement, or offer to buy or sell any securities, franchises, or other financial instruments, particularly in jurisdictions where such activity would be unlawful.
All content is of a general nature and may not address the specific circumstances of any individual or entity. It is not a substitute for professional advice or services. Any actions you take based on the information provided here are strictly at your own risk. You accept full responsibility for any decisions or outcomes arising from your use of this website and agree to release us from any liability in connection with your use of, or reliance upon, the content or products found herein.